Sorting data
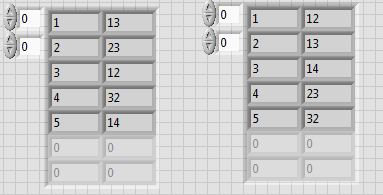
This is the data that I get and I need to sort these data according to the date and time... I try a few methods but not able to solve... Help, please
date data hour
0.5 1090313 13300
1.0 1090313 23100
3.0 1090314 08150
0.5 1090314 05250
5.0 1090314 08150
0.5 1090314 05400
0.5 1090314 08150
4.5 1090314 08200
0.5 1090314 07550
2.0 1090314 08200
3.0 1090314 08250
0.5 1090314 07550
0.5 1090314 08000
3.0 1090314 08250
2.0 1090314 08300
0.5 1090314 07550
1.5 1090314 08300
3.5 1090314 08350
0.5 1090314 08000
2.5 1090314 08400
1.0 1090314 08450
1.0 1090314 08500
0.5 1090314 08550
0.5 1090314 09050
0.5 1090314 16300
3.0 08000 1090314
2.5 1090314 08050
4.0 1090314 08100
0.5 1090314 05200
2.0 1090314 08100
Here is a quick fix that sorts by the date/time string. Modify if needed. (LabVIEW 8.0)
Tags: NI Software
Similar Questions
-
Sort data with display each trip
HY,
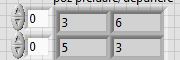
I need a VI witch sorts data with 2 aray.
In this image, I first aray after sorting, the first column is position of cd rack and second column is the number of cd.
To sort, I use position 6 in rack, this position is free.
To this picture of the situation as:
1-6
3 1
5 3
4-5
2-4
6 1
These are the movements that you do... I need a VI that makes it.
EX:
Good day.
-
sorting data - more great temp tablespace and temporary tablespace
Hello
Using oracle 11.2.0.3 and have a general question.
If have a query which has to say read 100 million records and the Group results it takes a bigger temporary tablespace to sort these data
Rathet than agnist an identical query summed up version of table (mview) including 25% of this amount - gbe that same but cliniquesdans need to read much less lines.
s.EG
Thank you very muchselect dimesnion.attribute1, dimesnion,.attribute2..., sum(sales) from fact, dimension where .... group by dimesnion.attribute1, dimesnion,.attribute2If I understand your question right, I think both group by must take the same temporary as space ' group by ' sorts data in the end after read data. As both the results of queries in the same number of lines, so group by clause will take same tablespace temporary unless there are fewer columns in the materialized view as the original table.
-
Hello
I try to make the dynamic structure (or if there is another method), in which case if change the entries in the first column, that I can get the correct table output. In the attached VI, the business structure is hardcoded with the first data of the column.
Basically, I'm trying to sort the table according to the entries in the first column. Is there a dynamic solution for this?
Thank you
hiNi.
Perhaps with the help of a variant attributes...
-
Sort data in columns in a multicolumn listbox
I have a listbox multicolumn on the façade with columns such as name, Type, Date modified, size.
Is it possible to provide a facility to the user to sort the data in the column during execution list box? It must be the same as expected in Windows Explorer in which the user can sort the data, either by name, Type, size etc.
Thank you
Siddharth
OK, I joined the vi in Labview 8.0.
I would like to know if it works.
Best regards -
That's what I'm trying to do. I have a file periodic_chan3.bin which is sampled values of three channels of periodic signals in interlaced format. The data is stored in binary format (long of floating point of the double procession) DBL and big-endian representation. I am reading the file and draw all the three waveforms on the graph of a waveform. The data has been saved from time zero, with a sampling frequency of 100 samples per second. Then I scale the x-axis of your waveform graph so it displays the time in seconds.
So I try, on the wave of the chart to create three sets of cursors and cursors to display the average value of each of the three waveforms. The color of the cursor Y for a given signal average must match the color of the display of the waveform on the chart. For example if the graph of the signal is displayed in red the cursor there shows the average of this signal must be red.
What happens when I do not open the file I see a white contour mesh a sine graph, a graphical square and sawtooth chart. I can't seem to trace the three waveforms seen clearly with the three above-mentioned distinct colors. I can't seem to sort correctly and represented as mentioned above.
I would also help with the calculation of the average or expected from each of the three periodic waveforms.
Attached are the files please help. Pgm4 is the VI, and periodic_chan3 contains the data that needs to be sorted. I'd be very happy if somene were able to fix the and submit the changes so I can see how it works. Thank you.
Edit: I get an error that says periodic_chan4.bin "is not a valid extension of an attachment" so I'm not able to uplad it. Is there a way to othe I could download it?
Xtasy26,
In your post you mention that you try to view 3 averages of waveform, however your code is showing that you are broadcast 4 values. This might be the reason why your getting the different forms of data. Instead of an array of all the waveforms 1, then a table of all 2 waveforms and a waveform table 3, you get a mix of all three in each of your waveforms.
To calculate a moving average or mean that it is actually an integrated in the example in BT sound finder called "running Avereage.vi calculation"
You can also view the attachment to see Multiple waveforms channel displayed on a single chart.
-
Sort data in date format DD/MM/RRRR
Hello
I have to sort our data between two dates ex 01 01, 2016 to the 31/01/2016 for the list of transactions.
Will I convert in JAN-16 format so that I can sort by where period_name like ' JAN-16'?
If so how do I convert a date format of 01/01/2016 JAN-16?
Thank you
Hello
Whenever you have a problem, please post a small example data (CREATE TABLE and only relevant columns, INSERT statements) of all the tables involved, so that people who want to help you can recreate the problem and test their ideas.
Also post the exact results you want from this data, as well as an explanation of how you get these results from these data, with specific examples.
Always say what version of Oracle you are using (for example, 11.2.0.2.0).
See the FAQ forum: Re: 2. How can I ask a question on the forums?
As Chris and Tubby has said, all DATEs are stored in the same internal format, which has nothing to do with the format you use to view or format you use in conversion as TO_DATE functions.
Oracle provides many functions and other features for the manipulation of DATEs, you seldom need to convert them to another format. For example, we wanted to get a list of employees of the scott.emp sorted by month and by ename; in other words, December 1980 would come before April, 1981, as from habit, but the day of the month, hours minutes and seconds would all be ignored in sorting. We can use the TRUNC function to do this:
SELECT TO_CHAR (hiredate, 'Mon-YYYY') AS hiremonth
ename
hiredate
FROM scott.emp
ORDER BY TRUNC (hiredate, 'MONTH')
ename
;
Output:
HIREMONTH ENAME HIREDATE
---------- ---------- -----------
DEC-1980 SMITH December 17, 1980
Feb-1981 ALLEN 20 February 1981
Feb-1981 WARD 22 February 1981
Apr-1981 JONES April 2, 1981
May-1981 BLAKE may 1, 1981
Jun-1981 CLARK June 9, 1981
MARTIN 1981-Sep 28-Sep-1981
Sep-1981 TURNER 08-Sep-1981
Nov-1981 KING November 17, 1981
DEC-1981 FORD December 3, 1981
DEC-1981 JAMES December 3, 1981
Jan-1982 MILLER January 23, 1982
Apr-1987 SCOTT April 19, 1987
May-1987 ADAMS 23 May 1987
Notice how MARTIN comes before TURNER in the output (I marked these Redlines), even if MARTIN hiredate is 20 days later than TURNER. This is because only the year and month are considered in the sorting. Any DATE in the same month will get the same sort value.
-
Hi Experts,
Here's the requirement I need to sort the text Text_field field say to sort this column, I called another field. Sort_Text_field.
I have the pivot table as follows
Can I sort Text_field even if Sort_Text_field is not in the PivotTable on the side.
Thank you!
Month1-(Jan) Month2-(Feb) Text_field MetricValue1 MetricValue2
Thank you!!Just in case if helps others. Tim Dexter tanks
Follow this link: https://blogs.oracle.com/xmlpublisher/entry/new_skool_crosstabbing
Customization
One new feature that I discovered this week is the ability to show a single column and sort by another. I got a data set which was extracting the month abbreviations, we wanted to show for months through the top and headers of lines on the side. As you know XSL is not very good with dates, in particular recognizing the names of months. He just wants to sort them alphabetically, so, after comes before Jan, etc..
A way around this is to generate a number of months to the sides of the month and which allows to sort. We can do that in the crosstab, unfortunately it is not exposed in the user interface still but its doable.Go back and take a look at the initial crosstab command. especially the line inputs and columns. There, you will find the sort criteria.
"ProductsBrand {, o = a, t = t}, PeriodYear {, o = a, t = t}.
Note these key commas inside the braces? Because there is no field that precedes them, this means that the crosstab should sort on the column before the brace that is PeriodYear. But you can insert another column in the data set to be sorted. For myself how I needed to work.
<>" _Fund_Type_._Fund_Type_Sort_, o = a, t = n} ';' _Fiscal_Period__Amount__._Amt_Fm_Disp_Abbr_ {_Fiscal_Period__Amount__._Amt_Fiscal_Month_Sort_, o = a, t = n} ';' _Execution_Facts_._Amt_ ';' amount '? >
Excuse the horribly verbose XML tags, good ol' BIEE: 0) emboldened columns are not in the table, but in the data set. I just open the field, dropped and changed the value type (t) is 'n', number, instead of the default 'a' and my crosstab started sorting how I wanted that it.
If you find other tips and tricks, please share in the comments.
-
I create a custom processor written for the simple task of a data set based on the values in a column to sort. I've seen a custom processor example with following behaviors (tags nested in < results >):
        <view name="counter" viewtype="variable" metricid="2" sortby="cp.countcol d" drilldown="bytype">
          <guidata>
            <label>Credit card types</label>
          </guidata>
          <!-- Type and count -->
          <columns>
            <columnset name="cp" ref="countpercent"/>
            <column name="typecol" datum="$key">
                <guidata><label>Type</label></guidata>
            </column>
            <!-- Number and % of records matching the pattern -->
            </columns>
        </view>
As you can see on line 1, there is a sortby attribute. Is it possible to apply this same attribute to a faucet?
If this is not possible, is there another way that the output data can be sorted by an attribute?
It should be a simple case of Siebel displays results in the order of the partition, as it should.
I don't think it's a good idea to try to do this in Disqualification.
-
Use drag and drop to sort data in the report
Hello!
I found a good description to sort the data in a tabular by drag and drop form.
Hello
Here's the example query:
SELECT
  empno,
  ename,
  job,
  mgr,
  hiredate,
  sal,
  comm,
  deptno,
  APEX_ITEM.HIDDEN(1, rowid) AS sort_col
FROM emp
ORDER BY display_seq
Change the SORT_COL attributes:
The value column report Standard display type.
Add in the link text column
 #SORT_COL#
Replace the URL and URL target #.
When you submit page you get rowid in APEX_APPLICATION. Table G_F01.
Kind regards
Jari -
SortItemsOn, method (sorts data by more fields)
Hello
I have a DataGrid that I want to be sorted by two fields in one place. (it works fine with one paid however)
I use the SortItemsOn() method which, according to the documentation, sorts the elements of the current data provider by one or more of its fields.
However, if I add two fields I get a weird result. for example
datagrid.sortItemsOn ("Field1, Field2", Array.NUMERIC);
Field1 is of date data type and the text field Field2 so maybe that is why he does not give the expected result.
Thank you very much
I know nothing about flash. There are several for flex.
but for flash, just make your own by using a custom sort. for example,.
function sortGridF (): void {}
var datagrid.dataProvider = dp:DataProvider;
dp.sortOn (["Field1, Field2"], Array.NUMERIC);
}
p.s. Please check the useful/correct.
-
How to add sorting Date columns?
Hi all
I have to sort the column date OBIEE answers. I registered using the type of the sort option by clicking on edit option-> sorting-> sort object growing option. Even in this case sorting will not apply to the column. What could be the problem.
Anyone please shed some light on this issue.
Thanks in advance,
Stephanie875991 wrote:
Hi allI have to sort the column date OBIEE answers. I applied the sort by using the sort option by clicking on change of object-> sorting-> sorting option growing option. Even in this case sorting will not apply to the column. What could be the problem.
Anyone please shed some light on this issue.
Thanks in advance,
StephanieYou are talking in a PivotTable? If Yes, then you do this:
(1) duplicate the layer of data column and drag it all the way to the left.
(2) apply the type of this column.
(3) hide.
In PivotTables, OBIEE sorts from left to right, whatever by clicking on the arrows to sort. To sort by a particular column, it must be further. If you want a secondary sort, to duplicate the layer of this column and move to second on the far left. Hide the columns so that you do not see the columns twice. Of course, if the column you want to sort by is already in the extreme is left, so no need to duplicate the layer. Simply apply the sort. Most people, however, that the sort to be elsewhere in the section column lines and that's why you need to duplicate the layer, sort and hide.
I hope this is what you have been struggling with.
-
Hello
I use 11.1.2.1. I created smart slices on a cube ASO where the requirement ranging and sorting of data. For example, I pick up the revenue of the cube figures and all dimensions are in line or POV. The measures are in the column. Range of revenue of $0 - $1000. I want to sort the range by the amount of revenues (ascending or descending) and I also want to see how much my business fits into a certain range (for example, between $500 - $600). These are all necessary to analyze the data from the different point of view.
Please let me know how I can do it.
Thank you.I have not tried, but I guess that you can also use the query designer and replace the MDX generated by an Order clause) or run an MDX erpression from a macro. You can also use toppercent and bottompercent if you want just the percentage of top members X
-
How to sort data in XMLListCollection data?
Hello
I use XMLListCollection object to contain the object, and this object has name, email etc. of property, but I want to sort the data in ascending order accordingly...
Please help me how to make this thing in XMLListCollection...
Thank you
one
Hello
Here are some links to sort the data in XMLListColection, please check it out
http://blog.flexexamples.com/2007/12/04/sorting-XML-documents-using-an-XMLListCollection/
Thank you and best regards,
---------------------------------------------------------------------- ----------------------------
Kanchan Ladwani | [email protected] | www.infocepts.com
---------------------------------------------------------------------- ----------------------------
-
I worked on a project that returns the numbers of the database I want to display in the data grid. I want that they appear formatted as price. If I make them price with the $ and the. Then, they are considered as strings and will not sort correctly. If I let the numbers I can use digital sorting and they work fine but the terrible look, what is the solution. I can't find it anywhere like for AS 2.0.
Thank youI'd be inclined to address this problem in a slightly different way, to keep the values of price in the form of numbers and display only as formatting of values.
Like this:
Maybe you are looking for
-
The automatic update on Firefox poses a security problem as they say some sites
I just noticed that some sites say that the automatic update of Firefox is a security risk and I was wondering if it was true
-
How can I clear the cache of Fire Fox?
I can't empty my cache in FireFox?
-
When I close FF4 I not give me the ability to save multiple tabs open on my next session
When I upgraded to FF4, I was sad to see one of my favorite features was no longer there. With a mile long bar address and the home button which is almost off the screen. I also noticed that there is no history button next to the front buttons and ba
-
Malware Removal issues/Questions
First of all, I am secular computer. I don't know that much about the techinical stuff. I have XP Proffesional and it comes to my personal home computer (not network). I have McAfee Security Center, continuous coverage since the purchase of the compu
-
Problem scanning on Officejet 4500 G510g
I need to copy something immediately, but whenever I turn on the camera, it gives me the error "failure of Scanner. Unable to scan, copy or send a fax. "right after the message"warm up ".