Stacked waveform diagram
Hello world
I merged three signals and traces on a waveform graph. There are three graphs the stacked on top each other so I know it works. I was wondering if there is a way to plot them on a single diagram? Is it something in the properties I'm missing?
Why have you selected a stacked chart when you placed on the front panel? This is not the default. You right click on it?
Tags: NI Software
Similar Questions
-
Reference to the waveform diagram
Hello world!
Im having some problems with my code. I can't put a reference line (or another function, as a sinusoid of reference) in the waveform table, I tried to put a package but I couldn't make it work, the wire bundle not on the list of waveform. I would like the references to stay still and moves not as pictured.
the other thing is that im working with control of the force, and I want to record in a table of max 3 force values (there will be 3 tasks of the maximum force, and I want to save the 3 max values with 60 s interval between them, by running the program only once), but it does not work.
some ideas, please?

To write more than one location in your chart, you need an array of waveforms. A waveform will be your reference. You can make one for each of your values of max.
-
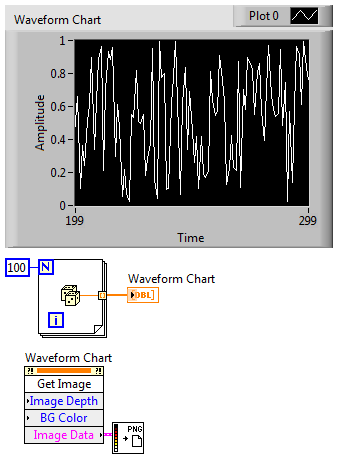
Capture of waveform in the waveform diagram
Hello
I am trying to capture the waveform in the waveform table save it as an image.
The reason why I'm not backup data is that we have a lot of test data and we do not want to draw hundreds of waveforms again manually.
No one knows how to do?
Thank you!
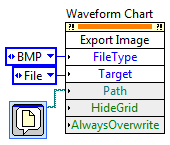
Here's an easy way to save an image of the graph.
You can save only the graph as BMP, EPS, EMF, or PICT with another method:
-
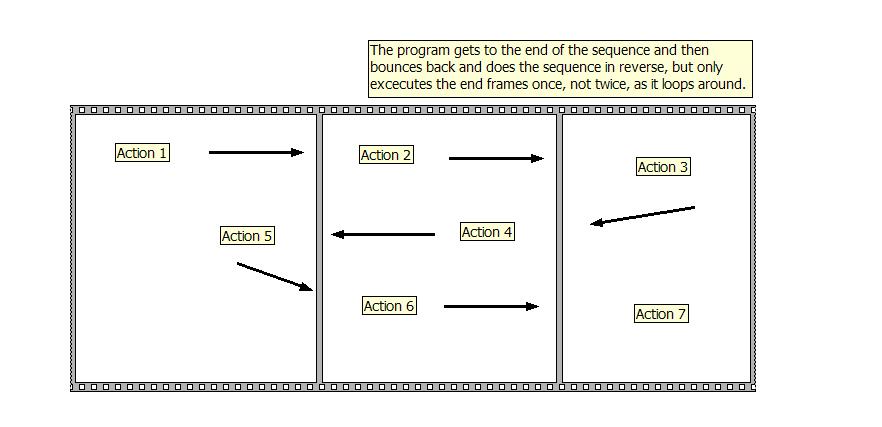
Order the dish/stacked sequence excecutes
Normally, a flat structure to sequence in a loop for if Execute from left to the right until it reaches the end and then repeat the left right code as many times as the loop he tells too much.
I want to be able to change the order / discreet in which the sequence loop around, so that my excecutes stacked in the 'Z' patter above sequence. He needs to realize from left to right until it gets to the end, then bounce back (without repeating the last image) and run from right to left, until it hits the start frame, bounce again (without repeating the start frame), and executed from left to right to what he hits the last image, bounce back again once , etc etc etc, many times I have to say.
Tips on how to achieve this?
Forget the flat/stacked sequence diagram. They are only as a LAST resort.
If all your actions was I sup vi then call one by one in a while loop. You can use a cluster of error to force the flow of data between the sub of vi.
If not go get some Statemashine. There are a lot of entries on this site for State mashines in LabVIEW.
-
Incorrect data that appear on the table of waveform
I have two cards of waveforms in my vi, two current plot or tension. After that I created an array of data points, I send them to the waveform diagrams. The datapoints are completely incorrect when tracing (scale, no points, no autoscaling) Although, when I export my data to excel, it is perfect. All possible solutions on how to fix this? I have attached my vi for reference (sorry if this is a bit messy). I use the tab control and my problem is statement of the case "Ids vs Vgs.
You can cheat and use the graph XY Express or use a couple of dice shift registers of Y and build separate X. There is also the example of the graphic called expedition XY.
-
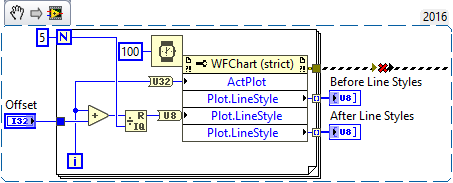
Graphical waveform Linestyle Bug?
Hello
I found that problems associated with the waveform diagrams and line styles in LV2016. If I change the line style of a multiplot for long dotted graph, the plot is changed for long dashed, but if new values are added, they will appear as short rushed. If there are other long plots dashed, they are modified short wiped out too. It happens with all styles (modern, classic, silver).
Everyone knows about these problems? Try again with the example below.
Niklas
The good news is that you are not crazy, LabVIEW 2016 's erratic behavior. In an attempt to discover what had happened and who was responsible, I wrote a little routine to read and set the Styles of plot line for graphic signals 2 consecutive values from 0 to 4 with a variable delay (so I could put 0, 1, 2, 3, 4, or, say, 2, 3, 4, 0, 1).
My initial code read the line Style, and then return. I could tell by looking at the plot that something wasn't right, and if I ran it again, I could see what values were used. For example, if I put 0, 1, 2, 3, 4, I had 0, 2, 2, 3, 4, while 1, 2, 3, 4, 0 gave me 2, 2, 3, 4, 0. Since I did the reading before writing it, I needed to run the code twice to see what did the writing, so I changed the code to read, write, read, as shown below:
(The error shown above, dotted line was 'dug' NiklasN While loop to ensure that ran first).
Either incidentally, I added the delay time within the loop "just in case" LabVIEW need time to "adjust" the plots - I think it is probably indifferent...
To my surprise, the line Styles after were exactly what I expected - with an offset of 0, 0, 1, 2, 3, 4. However, if I immediately revived this code, the front line Styles (which should have been 0, 1, 2, 3, 4) were now 0, 2, 2, 3, 4, false! Also, if you look at the plots when you run the program several times without change to the Offset, you see Plot 1 change the appearance (probably when my 'put' loop runs) and then switch again as the numbers start to come there.
I just called Tech Support, made to this post, attached the code illustrating the problem (so they will have something to test), and I expect that they will confirm the Bug and drop off a CAR (report on the Corrective Action) to solve this problem. Thank you, NiklasN, to describe this issue.
Bob Schor
-
Scanning for the graphic of wave speed
I inherited this application and am a beginner in LabView. I hope that someone can give me an idea about the problem, I'll have.
The application initially data displays using a set of waveform diagrams (plot of scanning). I need to add a new card game that does the same thing with slightly different data. Most of the maps work fine, except one. Somehow this graph struck twice faster than the others. My new maps all started as clones of the original cards, so I don't understand why it does not work like the others. I see not all properties that seem to affect the scanning speed in my vi either.
I would be grateful some starting point to search for what may be causing the fastest scanning speed.
Thank you very much.
You'll probably need to zip code or screenshots to get useful answers.
That said, there could be a couple of things at play here. The length of the graphic history defines the amount of data is stored, and if that length is reduced, the graphic display to sweep faster. It is set at the time of the context menu of the graphic editing and is not obvious by looking at the block diagram.
The chart is also updated every time that a value is written in its terminal, then it could be updated more quickly if it is in a loop with a shorter (for example). This is where it would be useful to see the comic.
Finally, since you are new to LabVIEW, I'd take a peek at this if you have not already:
http://zone.NI.com/reference/en-XX/help/371361J-01/lvconcepts/types_of_graphs_and_charts/
-
FPGA target host DMA FIFO multi-channel
Hi people,
I have a little trouble to collect my FPGA application data. The control of my FPGA application loop is running and read data from set point between a host and target FIFO to a period of 50 uSec. I run a separate loop to write data collected form two channels in a target of FIFO host over a period of 1000 uSec. I'm taking the data from both channels and its reading on the host in bundles of 500 data samples. The first problem I have is that my method of reading times unless I put my data acquisition loop to run at a much slower pace. My FIFO depth host side is 60000, almost as large as the total number of data samples that I expect to collect in total.
I have another problem when trying to write the data to a table. Even if my method of reading does not expire, I don't think that will record the first beam of data that are read. I've initialized an empty table outside my acquistion of the side loop host and used the table VI build to take the current data set and add it at the end of this table. I then store in a shift register and pass it in the next iteration where I try to join the new data set to the old and so on. I expected to get a table with all the data, but as I said I'm only collecting the first set of 500. I wonder if my program structure is correct. Any help anyone could offer would be greatly appreciated. I have attached a few pictures of my reference request. Thank you.
Hi Daniel,.
Thank you for your response. I think I found a solution to the problems that I had. Looks like it was a combination of a couple things. First, the data acquisition loop was running not until the movement was already over since I plugged the condition to stop the loop of writing deposit directly on the data read loop. This problem has been fixed by creating a shared variable for the stop condition and it wiring to two loops independently. This explains why I got only the first set of data, as it was stored in the FIFO until the end of the movement. However, the FIFO of feedback was still time. Before attaching the stop condition error, I placed a probe on the "items remaining" wire of the read method and concluded that there was only 1023 elements (the depth of the FIFO on the side FPGA) even if I set the FIFO depth host side to 60000. "» I realized it was originally due to the Read method not called for the first time until the end of the movement. Although the problem of break for most fixed condition this problem given that the Read method was now called during the movement, I decided to take a preventive measure and calling the 'Start' before the movement FIFO method is started just to make sure that the memory of PEP on the side host is available immediately.
So yes, it turns badly I put sync settings have been well after all. Good call on the reversal of the order on the Array function to build. Oh, and I also had to move the waveform diagram to until the table is built so that it is not Replot the old data on top of all the new data it receives. On the same note, I moved to the indicator in table at the end outside of the loop of reading. Thanks again for your help.
Kind regards
John has
-
Digital output with NOR-9401 in cDAQ-9174
Hello
I have a cDAQ-9174 with an e/s digital NOR-9401 module. Now I want to output Digital signals on line0:3
$line0: Boolean 1 time = 10ms
Line1: Boolean variable 1 time = 20ms
row2: Boolean variable 1 time = 30ms
line 3:20 pulses (period = 250us, duty ratio = 0.5) after a time = 40ms
the value of line0:3 must be Boolean 0 after 45ms
Can someone let me know what I need to work to solve this please?
Thank you all for your help.
Concerning
Bing
Thank you Christian for your quick replay.
I have some experience in programming of microcontroller with C. I learned LABVIEW for about 1 month and followed a lot of demons in line and tutorials. I know that nodes DAQmx Data Acquisition screws and fundamental property.
As I said at the beginning on the $line0, lin1and line2, they serve to control the relay in my circuit. 10ms could be controlled with the OS clock. Pulse of line3 series is used for IGBT gate signals, which is the critical moment. I want to use the clock machine to accurately control line 3 and synchronize at the same time the pulse with analog inputs from an another two NI9206 modules in the same cDAQ chassis.
I just want to know more on the digital line demand signal relay output and a correlation between the line of analog input-synchronized finished pulse output. Waveform diagram is locked.
Thank you.
Bing
-
Tektronix 3052 b timestamp question
I think that this question will apply to many, if not all scopes for LabView interface, but it's the one that I tend to use. I have managed to connect the field of LabView application over the network and can run the demo applications quite well.
The particular test that I am running is that awaits a coming special trigger, after that is captures 10,000 samples of 1 microsecond increments each.
If I don't have LabView and export the data file directly, it has a timestamp value that is right; check-in starts at-40 microseconds (that's the point that the scope begins to record the sample) and flows through ten following time milliseconds.
The time stamp that is acquired by LabView, is however, formatted in this format:
7:00:00.009 PM
31/12/1903I was able noodles autour with parameters in time waveform diagram time string Date and get the display on the screen to display microseconds by entering a string "6u %" in the time format string string date/time format. However, there are two outstanding issues:
1. the string that is exported to Excel ends by displaying the calendar stuff. No amount of playing with settings in Excel doesn't allow me to reduce the string to a single integer representing the number of microseconds past
2. the point of departure - t0 - always by default is "0", which means that the data are not aligned to the correct microseconds in the graph of the wave.
I've seen examples in the online support files, and that's how I got the point of being able to display microseconds. No one seems to have attacked, however, the problem simply allow the exit number by the scope as "t0" to the passage in the spreadsheet file. Anyone got any ideas? There is little for me...
Thank you
Danielle
Thought this might help; the graphic on the screen updates correctly, but the spreadsheet contains too much junk and not in the right format or starting point in time (see attachment)
You can have any desired accuracy. Just change the format specifier.
If you don't know what that means, put running context-sensitive help (which you should have any time, in any case), and move your mouse on the entry in the spreadsheet file.
-
Make a graph that is customized by using the motion of the instrument and in real time
I am very new to LabVIEW and I need to make a graph or a table with the data being the movement of a device and the x data in real time. I know how to get the position of the instrument information and how to put in real time for the x axis, but I have no idea how to wire those things in a graph, what type of graph to use, or what other screws I need for the y - data. I have attached the page I'm working on that... It's kind of just a meli melo of things I thought that may be useful, but I obviously need help. Thanks in advance.
Have you so far in your VI, it seems you will ask some data on the location of your device on each iteration of the loop. In this case, you can use a waveform diagram in the while loop to display these points. Each new point will be added to the table as they come. You can do this by writing values to the table as you reach them inside the while loop. This link should also be able to clear up some confusion about the differences between the tables and charts in LabVIEW.
-
Track of multiple graphs on a single diagram of waveform with dynamic data types
I'm putting multiple charts on a single diagram of waveform and data contract error. I was wondering if it has something to do with the fact that the dynamic data is used (I have had no problem with other types of data in the past). Does anyone know how to fix this? I have attached the following .VI. There will be a lot of. Live on the bottom which does not load, but they are not related to this problem.
Thank you!
Brian
I don't know what you're doing now, but a part of your origianl code is simply ridiculous. Your DAQ assistant takes a single point. You convert that into an array. If you had converted into a scalar value (which is) first place, your graphics update would have been fine.
If you want to remove the DAQ Assistant, and then select generate DAQmx code. You'll be a little more closely, but it seems that it generates a NChan DAQmx Read 1Samp instead of a 1Chan 1Samp DAQmx read.
-
Waveform table, draw and dynamics of double data
Hi all!
I would get separate plots on a single waveform chart.
In fact, I'm simulating 4 signals (but in reality, it would be the signal from sensors) and I would get 4 plots.
In the end, I only get 3 plots and no 4.
It's very strange... Yet, I chose 'Stack slots' and ' 4 plots illustrated.
In fact, I see that the last data has been merged with the first.
How can I fix it?
Thank you!
I don't know how you got in this State but try to go into the properties of the graph (diagram of front right click and click Properties in the menu) and on the appearance tab, uncheck "stack slots", uncheck "Show Displays digital (s), press the"OK"button, then go to the properties again and select again these two boxes and press OK.» It should correct the problem.
-
How to make a stacked cluster chart?
I am creating a cluster diagram, classified by different emails sent to customers (let's call them 1, 2 and 3 Email) and has each kind of stacked e-mail based on the answer (opened, clicked). Is it possible to have your chart be grouped and stacked? The x-axis are labeled by the day of the week, and I would be more group by email (1, 2 and 3) every day.
Thanks in advance for the help!
Numbers isn't a stacked column cluster chart. But you can use a 3D stacked column and can 'cheat'similar to the way you would in Excel.

The trick is to leave blank lines in the table of data which, when the fill color is removed, the differences between the clusters form.
I don't understand how to get the labels for each cluster in the right place. When the two left columns are defined as cluster labels column headers appear where it is indicated in the screenshot, is not ideal. It is possible that the days of the week may have to be manually labeled with text boxes.
SG
-
Why the table in the output of MT complex waveform modulation FSK 255 elements missing?
Hello! I posted my question in the LabVIEW forum but an application engineer suggested I post here. I'm new so any help would be appreciated

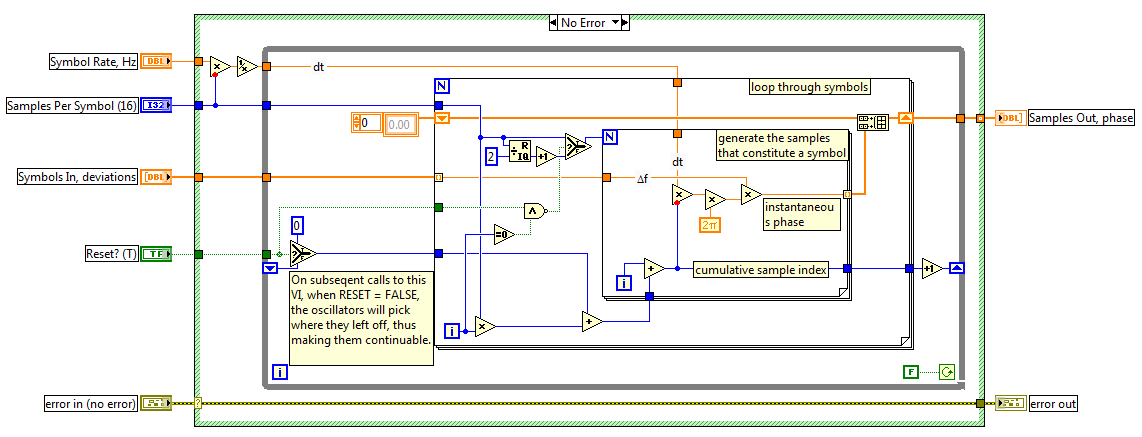
I use this example FSK in LabVIEW (VI is attached). As it can be seen in the block diagram, the number of samples by specified symbol is 512. If I run 2 - FSK, I have 1 bit per symbol. So I if I have 128 bits, 128 symbols. and if I have 512 samples per symbol, I expect 65536 samples/elements in the complex waveform of the MT output modulation FSK. However, I get only 65281 elements in the table. There are 255 missing items.
If I run 4 - FSK and have 128 bit or 64 symbols, I expect to 32768 in the table. But then again, I'm running out of 255 items and get 32513.
Am I missing out on something? Have I misunderstood something? Thank you very much for your help.
I get the same results as you!
I Dove a little inside, and it seems that the code that generates the symbols, two layers down, which reports an explanation to this.
If you open MT modulate FSK.vi, then mod_FSK modular Phases.vi discontinuous to generate in the discontinuous case of the structure of the case, you will see the following code.
You can see that when Reset is set to True (the default) and the external-loop for is in his first race, the inner-loop for work (samples per symbol) / 2 + 1 times (in your case, this number is 512 / 2 + 1 = 257.) Subsequently, the inner-loop for runs with 512 for each outer loop for iteration. This means that the first round fail to 512-257 = 255 samples, which causes the total to 255 less samples.
I don't know what is the motivation behind this design. As a test, you could connect in a constant False to Reset of the MT Terminal modulated FSK VI, which causes all the samples to generate.
Hope that clarifies it.

Maybe you are looking for
-
iTunes has been able to 'see' my iPhonr 6 more
I'm trying to dl and install an app on the iTunes store on my iPhone6 more. Somehow, iTunes can't find my iPhone. I am running windows 10 (! @# $) I use iTunes 12.3.3.17 iTunes says version is up-to-date. Earlier today, I ran a backup of the iPhone,
-
HP 50 g - graph of the function of library
Hello I try to graph for example the distribution function UTPN (cumulative normal distribution) with two parameters set and the third as a variable. I tried in vain in the 2D/3D window (ALG mode): (a) entering the function UTPN (0,5,X). When I want
-
Satellite T110 - Bluetooth detection of service failed
Hello I recently bought a Satellite T110 - 12 p and when I try the PAIR any device with my laptop, I get this message: "Detection of Service failed. . Windows 7 Professional 64 bitDriver of BT: 7.10.10 Anyone with the same problem? Thank you.NS
-
What is the best size for a buffer overflow in BlackBerry?
Hi all In my application, I need to read data from an input stream. I put the current size of the buffer for reading as 1024. But I saw in some applications Android size memory buffer has been preserved as 8192 (8 KB). Is there a specific advantage i
-
RAM not detected in Windows Pro 8.1 x 64
Hello. I hope someone can answer my question. I have 2 x 4 GB RAM installed in my computer. Everything works fine under Windows 7, but as I have upgraded to Windows 8.1 earlier, I noticed that the computer recognizes only 4 GB of RAM in the system. W