Time scale...
Is there a way to create a rule with number and simple lines and controlled by lingo and a text field so that it reacts accornding both in the text field?
Let's say I have in the text field 04:59 then the script organizes the lines with four lines more above to indicating four minutes and three smaller between highest indicating 15 seconds each.
I have not an idea slowed how do this. It is possble?
Thank you
Brian
Hi Brian - I had a try at this and concocted the following behavior. Copy and paste it into a script Member, and make sure that it is typed correctly before dragging on a bitmap sprite (the one that you want to display your graphic timeline). It must be sent the message to be drawn from this chart. For example, if the graphic sprite (with this attached behavior) is the number 5 of sprite, and you want to draw a timeline of 04:33, you'd call with
sprite(5).mMakeTimeline("04:33")
property spriteNum
property my
property myMember
property myImage

property myWidth
property myHeight
property myBackgroundColour
property myTextColour
property myLineColour
property myShortLineHeight
property myMediumLineHeight
property myLongLineHeight
property myQuarterFontSize
property myMinuteFontSize
property myFont

on isOKToAttach(me, sType, sNum)
  if ( sType = #graphic ) then return ( sprite(sNum).member.type = #bitmap )
  return FALSE
end

on getPropertyDescriptionList
  pdl = [:]

  pdl[#myWidth] = [#comment: "Width of image to create:", #format: #integer, #default: 1286] -- #default: sprite(the currentSpriteNum).member.width
  pdl[#myHeight] = [#comment: "Height of image to create:", #format: #integer, #default: 94] -- #default: sprite(the currentSpriteNum).member.height

  -- this used to display a colour chip in the resulting dialog
  -- I don't know what's changed between  D7/8 and now...
  pdl[#myBackgroundColour] = [#comment: "Colour of image to create:", #format: #color, #default: rgb( 196, 186, 180 )]
  pdl[#myTextColour] = [#comment: "Colour of text to draw:", #format: #color, #default: rgb( 0, 0, 0 )]
  pdl[#myLineColour] = [#comment: "Colour of lines to draw:", #format: #color, #default: rgb( 0, 0, 0 )]

  pdl[#myShortLineHeight] = [#comment: "Height of 5 second interval lines to draw:", #format: #integer, #default: 24]
  pdl[#myMediumLineHeight] = [#comment: "Height of 15 second interval lines to draw:", #format: #integer, #default: 35]
  pdl[#myLongLineHeight] = [#comment: "Height of minute interval lines to draw:", #format: #integer, #default: 46]

  pdl[#myQuarterFontSize] = [#comment: "Font size of 15 second interval text:", #format: #integer, #default: 10]
  pdl[#myMinuteFontSize] = [#comment: "Font size of minute interval text:", #format: #integer, #default: 14]
  pdl[#myFont] = [#comment: "Text font:", #format: #font, #default: "Arial"]

  return pdl
end

on beginSprite me
  my = sprite(spriteNum)
  myMember = my.member
  myImage = duplicate(myMember.image)
end

on endSprite me
  myMember.image = myImage
end

on mMakeTimeLine me, sTime
  -- sTime should be a string and formatted as "mm:ss"
  if stringP(sTime) = 0 then return
  -- how many seconds were provided
  tSeconds = _movie.HMStoFrames(sTime, 1, 0, 0)
  -- if this evaluates to an invalid input then bail out
  if ( tSeconds = -2147483648 ) OR ( tSeconds = 0 ) then exit

  -- long marker at 0 then short one every n pixels (representing 5 seconds) with longer
  -- one at 15, 30 and 45 seconds intervals and longest (thicker) line at minute intervals
  tInterval = 5.0 * myWidth/tSeconds

  -- create image and fill with BG colour
  tImage = image(myWidth, myHeight, 32)
  -- fill image with BG colour
  OK = tImage.fill( rect(0, 0, myWidth, myHeight), [#shapeType: #rect, #color: myBackgroundColour] )

  -- make images for 15, 30 and 45s intervals:
  tTextMember = _movie.newMember(#text)
  tTextMember.font = myFont
  tTextMember.fontSize = myQuarterFontSize
  tTextMember.antiAliasType = #AutoAlias
  tTextMember.hinting = #TVMode
  tTextMember.wordWrap = FALSE

  tTextMember.text = "15s"
  tWidth = tTextMember.charPosToLoc(4)[1]
  tTextMember.width = tWidth
  image15alpha = duplicate(tTextMember.image.extractAlpha())
  image15 = image(image15alpha.width, image15alpha.height, 32)
  image15.fill( rect(0, 0, image15.width, image15.height), [#shapeType: #rect, #color: myTextColour] )

  tTextMember.text = "30s"
  tWidth = tTextMember.charPosToLoc(4)[1]
  tTextMember.width = tWidth
  image30alpha = duplicate(tTextMember.image.extractAlpha())
  image30 = image(image30alpha.width, image30alpha.height, 32)
  image30.fill( rect(0, 0, image30.width, image30.height), [#shapeType: #rect, #color: myTextColour] )

  tTextMember.text = "45s"
  tWidth = tTextMember.charPosToLoc(4)[1]
  tTextMember.width = tWidth
  image45alpha = duplicate(tTextMember.image.extractAlpha())
  image45 = image(image45alpha.width, image45alpha.height, 32)
  image45.fill( rect(0, 0, image45.width, image45.height), [#shapeType: #rect, #color: myTextColour] )

  -- finished creating images for seconds so set fontSize of text member for creating minute intervals
  tTextMember.fontSize = myMinuteFontSize
  tTextMember.width = 500

  -- draw long line at zero
  OK = tImage.fill( rect(0, myHeight - myLongLineHeight, 1, myHeight), [#shapeType: #rect, #color: myLineColour] )
  -- monitor start point and number of lines drawn
  tStart = 0.0
  tDrawIndex = 0

  repeat while TRUE
    -- add pixel width corresponding to 5 seconds to current draw position (x)
    tStart = tStart + tInterval
    -- make this an integer (pixels are integer values, not floats) - not strictly necessary as they will be auto-converted
    tX = integer(tStart)
    -- if this line will be drawn outside the full width then we're done, bail out of drawing routine
    if tX > myWidth then exit repeat
    -- increment the draw index
    tDrawIndex = tDrawIndex + 1
    -- set default height and width of lines drawn (over-ridden below if necessary - 15, 30, 45 and minute intervals)
    tHeight = myShortLineHeight
    tLineWidth = 1
    -- if the draw index divides evenly by 3 then it should be a longer line, with some text drawn above it
    if tDrawIndex mod 3 = 0 then
      -- override line height set above
      tHeight = myMediumLineHeight
      -- set height of text above line
      tStandOff = 2
      -- which second interval should be drawn above THIS line
      textIndex = tDrawIndex mod 4
      case textIndex of
        3: -- 15s
          tTextImage = image15
          tAlpha = image15alpha
        2: -- 30s
          tTextImage = image30
          tAlpha = image30alpha
        1: -- 45s
          tTextImage = image45
          tAlpha = image45alpha
      end case
      -- if the draw index divides by 12 then it should be a minute interval
      if tDrawIndex mod 12 = 0 then
        -- override height and width of line drawn
        tHeight = myLongLineHeight
        --        tLineWidth = 2
        -- set height of text above line
        tStandOff = 4
        -- create minute text image:
        tTextMember.width = 100
        tTextMember.text = string(tDrawIndex/12) & "m"
        tWidth = tTextMember.charPosToLoc(tTextMember.char.count + 1)[1]
        tTextMember.width = tWidth
        tAlpha = tTextMember.image.extractAlpha()
        tTextImage = image(tAlpha.width, tAlpha.height, 32)
        tTextImage.fill( rect(0, 0, tTextImage.width, tTextImage.height), [#shapeType: #rect, #color: myTextColour] )
      end if

      tLeft = tX - (tTextImage.width/2)
      dRect = rect(tLeft, myHeight - tHeight - tTextImage.height - tStandOff, tLeft + tTextImage.width, myHeight - tHeight - tStandOff)
      OK = tImage.copyPixels(tTextImage, dRect, tTextImage.rect, [#maskImage: tAlpha])
      --      put OK

    end if
    OK = tImage.fill( rect(tX, myHeight - tHeight, tX + tLineWidth, myHeight), [#shapeType: #rect, #color: myLineColour] )
  end repeat

  tTextMember.erase()
  myMember.image = tImage
end
Tags: Director
Similar Questions
-
How to trace my chart according to the time scale?
Hey a little help please. Im trying to draw a waveform on a graph in LW/CVI. The X_Axis is the scale and time axis is amplitude. I use a loop for to generate the matrices X and Y. I'm not sure how do the X table matches the time scale. I need X for increment in milli seconds. I changed the category axis of the chart hour time / absolute relative, but the problem is how to make the loop for incrementing the X-Array according to the clock.
Thanks for your help;
Rohit
Hi Rohit,
It is a fine example called TimeDateUnits that illustrates a continuous update of a xy graph, maybe you can have a look?
-
Hello
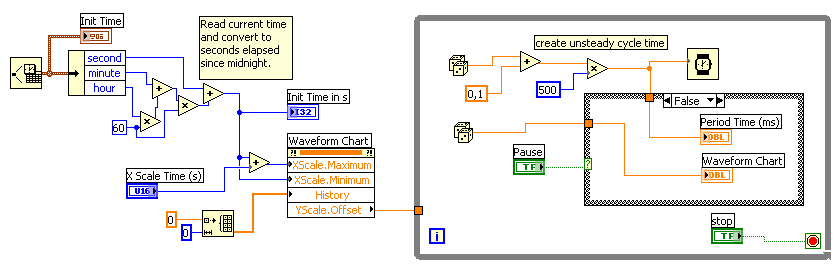
I have a view of the spectrogram (graphic of intensities) that I use as a cascade of Amplitude vs vs frequency time plot. This display receives real time incoming data from hardware and DSP performance (using toolkit spectral measurements) to return a single image FFT or update the display. My spectrogram is configured to have 100 updates on the screen at a time, and I have a buffer behind the scenes containing a total of 5000 TFF framework implemented to date. I paint mainly a scrolling display cascading with the ability to go back and look at the data.
The nature of current DSP to run on incoming data direct (too high a sampling rate for entirely real-time processing), on a windows machine and the only packages entering data when DSP is ready for more - my time scale updates are not accurate. I use the latest t0 of a packet entering data as the spectrogram scale is offset and then set the multiplier is regardless of the value of update rate (controlled operator). The update just control the number of FFT frames rates are averaged before a single update is published on the display/buffer.
So after a long explanation, my question is: would it be possible to have a time scale customized for my spectrogram so that the time be accurate throughout the history buffer? Currently, if the update rate is changed which will not change the time scale multiplier and all the old data on the display will have incorrect time values.
I guess I'm looking for a way to contain a table of 5000 timestamps with my 5000 updates and publish the most recent 100 timestamps/updates the display update rate. I saw the scale Y-> property [] marker values. It would be something I could put 100 timestamps on my screen?
Thank you
Tim Sileo
Hi Tim,.
I have attached a sample VI showing the features of the property of an axis marker values. If you have data aligned with the correct time stamp in your tables, you should be able to choose what timestamps to display with this property node. I hope this helps!
-
Time scale does not properly after separation of the two signals of virtual channel
Hi all
I have a problem when I use a virtual channel with two analog inputs. I'm cutting the two signals into two separate tables of waveform, as shown in the attachment. The two signals seem to be reading very well, the problem is that the time scale (x-axis) begins to act on the strange. Seconds displayed time seems to keep jumping up and down at a high frequency, resulting in the two signals of displayed does not correctly in the table of waveform. Could someone please try to help me? Any help would be greatly appreciated!

Thanks in advance.
Try to acquire a signal with first time information. You can replace the DBL 2D with a data type of 1 d wave. You don't need this code extra silly - just a function of Board Index to get the separate channels.
-
The timeline indicator is offset and the shadows on the time scale.
I have four questions relatively minor but still boring.
1. the indicator of chronology is compensated. Visual quantity remains the same regardless of the zoom timeline, that this also applies to some tools.
2 markers are shifted to the right when it is placed.
3. I get ghost images in the Panel noticed when the timeline scrub.
4 white lines appear on the time scale that the cursor moves on the screen. (No mouse clicks)
I did due diligence and asked around on some forums and searched the FAQ section and so far it seems to be isolated.


OK problem SOLVED :-)
If you have the size of the text on your PC that is greater than 100%, it seems to be the cause.
Control Panel > appearance and personalization > display > set to 100%
This was brought to my attention by NTV on a similar thread here.
The only other problem is now that the text on the screen is a bit small. But I will get used to that pretty quickly and the new Premiere Pro works fine again.
-
He's like a yellow gray slider on the sides, sitting under my time scale.

What is c?
Hello Ariella,
This is the workspace toolbar. You can disable it in the Panel menu on the right side of the timeline if you don't need.
Thank you
Kevin
-
Time scale: change of executives at the second question (photo)
For some reason any rule displays the images and not in seconds. I tried to browse the different modes of time by ctrl clicking on it as well as modifyign in file-> settings of the project, but the seconds will not be displayed on the time scale. Please look at the picture below. I also tried to reset the standard workspace by default with no result.
What I am doing wrong?
Thank you

The top timeline in your first post IS showing seconds. You're just expanded it so that it divides also seconds from executives. So it is meaning 1:00f (1 second) then 10 frames, 20 frames, then 2:00f (2 seconds).
Do more than the model is visible in time and you will see the frame identification disappear.
-
What is the blue-grey bar to the time scale?
I have re-opened a project and noticed a blue-grey bar to the time scale I don't remember having seen it before. I don't know what it does or how it got there. I do not speak on the workspace toolbar - it is higher than that. It has handles to extend it at each end and a capture area in the center of repositioning. I've attached a screenshot of it. Thanks to identify it for me.
This question comes up from time to time.
Truth, is what we call an artifact, rest of a characteristic that once appeared in Premiere Pro and never really existed in Premiere Elements.
It does nothing and only serves no function, and you can ignore it a bit. (I forgot how to disable - or how you accidentally active.) If you're really curious, you can ask your question on the forum Muvipix. I'm sure that someone will remember.)
-
Hello!
How can I create a function to write a ToolTip that provides details on the date at which the mouse points in time scale bars?
Any help would be appreciated.
dataTipFunction?
-
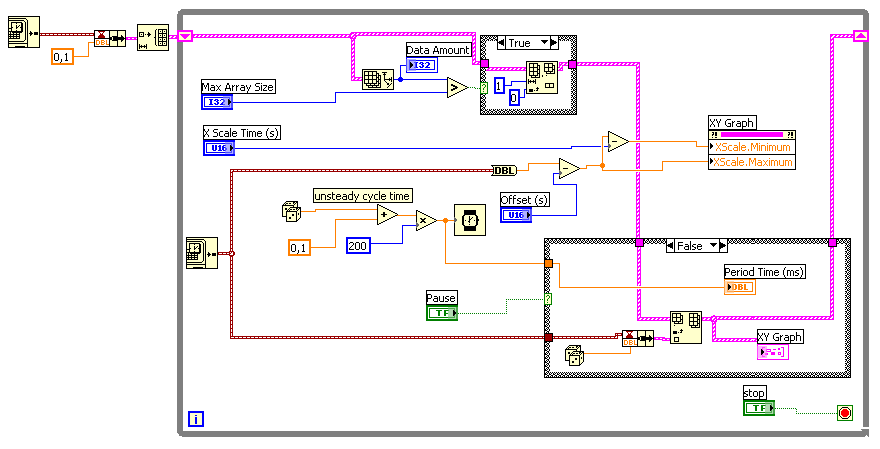
Problem with table of waveform: time scale do not see the time correctly
Hello
I have some problems with a graphic.
I want to display data, and the duration between two unique data can vary. It's something between 50ms and 500 ms.
The problems I have:
1. the time is not correctly displayed in the graph (allways 02:00:10 instead of the current time)
2. the data points in the table have a distance of 1 s (x-scale). This is not correct.I've tried several things, but I thinkt that I am on the wrong track.
Could you please help me?Johannes
LabVIEW 7.1 (!)
I'm sorry. The property on the left node was not necessary...
-
problem of remapping and time scale.
When I play with time-remapping and go get keys to scale images do not work, anyone know why?
Workaround solution:
Do your time remapping in a new sequence. Import this sequence on the main sequence, then apply the keyframes of the scale.
-
Two toppings selections in the time scale to the source monitor. (First Pro CC2014)
I'm really confused by this apparent novelty or glitch, pp. I'm working on an old project that has been improved cs6 by CC and now the CC2014. Several of my videos have evolved at a different point in the source media, so the clip is always the same length on the timeline, but contains a completely different part of the film. When I double-click the clip in the timeline to open it in the source monitor, I get two balances on the scale of time like this:

I'm quite confused by the present, I have never seen this. Especially I don't seem to be able to move one of them independently of the right section of the images enter my cup, and I can't delete any of them.
Is this something that is due to the upgrade, or is it a setting/preference changed CC in 2014. I did have this problem in any other project before installation of 2014 earlier this week and now I hesitate to initiate other projects in the case where he made a mess of them also!
The blue part is the video the audio part green (this has always been in first)
If you check selection bound (next to the key) it will probably be 'fusion' when you double-click it.
-
Analog outputs with different time scales
I use products AO of a card PCI-6731 for an application scan head and I have some difficulties to achieve peak performance, that I need. I am contolling the map with nidaqmx drivers in c ++
Basically, an output controls scanning in the direction Y (which is a line of scanning and is very fast) and the other in the X (increment once per scan line, so much slower). The complication is that both exits start at an external trigger, because positioning is synchronized to a separate data acquisition card.
Now, what I do is:
-write the scanline for 0 output waveform
-set output 1 to a given position
-say next Trigger output card
-hangs at the end and stop tasks
What I really want to do, it is just tell him to start with on each external trigger output waveform of scanline 0 and output 1 increment to the next position. So I could do a complete 2D scanner with a minimum of control software.
Any ideas on how I could best achieve this? My understanding of the nidaqmx drivers I don't see an elegant way to do it.
I could potentially do some operations on the done callback, although it makes me a little nervous because the control PC running windows, it is not a real-time operating system.
Hmm I do not know exactly but there are a couple of things (it is close)...
The output frequency of meter in your example 5 MHz (20 MHz, 2 high ticks, weak 2 ticks), which is faster than holders 6731 for a sample clock. I thought that this would have given a material error... are you looking for errors once the task runs (for example using DAQmxIsTaskDone)?. There is a DAQmxCreateCOPulseChanFreq if you want to set the clock frequency directly (it will use the appropriate default internal time base).
The task of counter generates 1000 pulses per trigger, is what determines the number of samples generated by the trigger (I assume that you want it to be 1024 aka "numSamples").
The analog output task must either use:
(1) calendar continuous if the output will repeat indefinitely as several triggers are acquired.
(2) finishes pitch (N * numSamples) samples where N is the number of lines that you want to exit and numSamples is the number of samples per line. In this case, the task will end once the lines were triggered.
Best regards
-
How to set "Time scale" to "None"?
Hi expert,
We want to set up an account where user can enter the individual monthly figs, with the total quarterly being either the sum of the value of months under him (i.e. flows), or as the last month of the quarter (balance), while the user can enter a value other than "YearTotal' in 'year Total '.
By default, user grasp what this either in the YearTotal, it would get spread to the individual months under him. Is it possible to disable this spread, so that the user can enter the total of the year, without affecting the monthly entries?
The period dimension is a dense dimension, with summaries members period the value "Dynamic Calc."
I'm trying to adjust the Balance of the 'time' to 'None' and hoping it would then not inherit the flow / characteristic balance in the total of the year. But when I try to deploy the application, I got error, saying: it's an hour not valid balance properties.
Please tell us if:
i. possible in order to set up a special account where every month and yeartotal inputable user? And if so, how?
II. what should be the behavior expected if the value "Balance time", "None"? and how to set?
We are on HP version 11.1.2.1.
Thank you!How are you making it to "None"?
You can stop the spread. (Jake Turrell explained how it works in a different thread)
If you create a form in line with the different months in logical columns/rows (not not selecting them using a function like Idescendents (YearTotal) or Jan, Feb, Mar), select them under the name of each column.
Column A
Jan
Column B
Feb
.......Then spread will not work.
I don't think you can possibly do this job using low version upwards. (simple reason that schedule does not allow you to write to top member, if your version is low at the top)
You can create a Standard Version of the target and then use the method above (splitting method of individual columns months) to achieve this.
Why do you want to enter YearTotal, why not use BegBalance and add values to this member? (Just a thought)
Concerning
Celvin
http://www.orahyplabs.com
Please check the answers as useful/correct as appropriate
-
Conversion to the second question time scale
In the project settings, I specified to use a 00:00:00:00 of time code where the timeline should display hours, minutes, or seconds in the film. However, the timeline shows still frames as you can see below. What I am doing wrong?

perfectblue wrote:
The first problem, I noticed that it's when I go back to the settings of composition, or view the timeline, it shows one minute and six seconds (0:00:01:06) for the duration of the model
No it's not. He demonstrated a second and six executives.
-
NEAT SQL - time scale between two records to find...
Hello everyone, first of all please let me apologize because it's a fundamental issue, however my sql is nowhere near as good as my design skills and I'm having a headache with something...
In simple terms, I have a table which we will call "TBL_MOVEMENTS".
In this table, we record the time several doors open and close. So we have the passes "DT" (Datetime in timestamp), 'DOORID' and 'STATE '.
For the sake of examples, we will say that we want to select the hours each door was open for. (actually every door will open and close hundreds of times)
The data in the table would present a little as follows...
DT DOORID STATE
----------------------------------------------------------------------------------------
2010-01-15 09:00:01.223 OPEN A3
2010-01-15 09:02:04.789 OPEN A1
2010-01-15 09:07:55.123 NARROW A3
2010-01-15 09:08:12.654 NARROW A1
In English the logic I would attempt in the direction of
Select the doorid and the timedifference between each open event and the very next event close to the same door.
If anyone can help I would be very grateful!Hi and welcome to the forum!
You are looking for something like this?
SQL> WITH door_events AS
  2  (
  3          SELECT TO_TIMESTAMP('2010-01-15 09:00:01.223','YYYY-MM-DD HH24:MI:SS.FF3') AS DT, 'A3' AS DOORID, 'OPEN' AS STATE FROM DUAL UNION ALL
  4          SELECT TO_TIMESTAMP('2010-01-15 09:02:04.789','YYYY-MM-DD HH24:MI:SS.FF3') AS DT, 'A1' AS DOORID, 'OPEN' AS STATE FROM DUAL UNION ALL
  5          SELECT TO_TIMESTAMP('2010-01-15 09:07:55.123','YYYY-MM-DD HH24:MI:SS.FF3') AS DT, 'A3' AS DOORID, 'CLOSE' AS STATE FROM DUAL UNION ALL
  6          SELECT TO_TIMESTAMP('2010-01-15 09:08:12.654','YYYY-MM-DD HH24:MI:SS.FF3') AS DT, 'A1' AS DOORID, 'CLOSE' AS STATE FROM DUAL
  7  )
  8  SELECT  DOORID
  9  ,       DT              AS DT_OPENED
 10  ,       DT_CLOSED
 11  ,       DT_CLOSED - DT  AS DURATION
 12  FROM
 13  (
 14          SELECT  DOORID
 15          ,       DT
 16          ,       LEAD(DT) OVER (PARTITION BY DOORID ORDER BY DT) AS DT_CLOSED
 17          FROM    DOOR_EVENTS
 18  )
 19  WHERE   DT_CLOSED IS NOT NULL
 20  ORDER BY 1
 21
SQL> /

DO DT_OPENED                      DT_CLOSED                      DURATION
-- ------------------------------ ------------------------------ ------------------------------
A1 2010-01-15 09:02:04.789        2010-01-15 09:08:12.654        +000000000 00:06:07.865000000
A3 2010-01-15 09:00:01.223        2010-01-15 09:07:55.123        +000000000 00:07:53.900000000
Published by: Centinul on January 15, 2010 14:46
The minor error.


Maybe you are looking for
-
I forgot my answers to security questions and I can not reset their. I can't buy or download anything. What should I do? help pls
-
Hello I have a NI 3110 industrial controller, which controls multiple NI 9144 EtherCAT slaves. Due to the drift to inherit the clock in the controller, I need to set the absolute of the Windows part of the program time periodocally. I do that with su
-
Trouble with first package app
Hello, everyone! I try to package my first application with the extension of the ripple, but does generate an ERROR in the console: In the extension of the ripple, I have the Red popup with the following msg: Oh Snap! Build request failed with messag
-
Check if the device supports touch screen
Hey all,. I want to show or not show data according to whether or not the person using my application uses a touchscreen device. Is there a method to verify this? I thought it would be in the DeviceInfo but I couldn't find anything relevant here or
-
JavaScript added with advanced actions does not run in LMS
I am working on a custom navigation bar which is controlled by Javascript, I added using advanced in Captivate 9 actions. It works very well in tests, but during the loading of our LMS and SCORM cloud custom JS doesn't load or is ignored for some rea