Tornado diagram
Dear members,
I want to create a Tornado diagram with Apple numbers.
I did some research on google, but practically everything I got is linked to Excel.
Any info or links in this regard would be helpful as to how I create a diagram of tornado with apple numbers.
Thank you.
Hi a_for_apple,
This sounds like an interesting question!
Is this something to do with risk?
Please post a screenshot of a small part of your data table (command shift 4 and drag) to help us understand and help.
More information about your goal will lead to a solution.
Kind regards
Ian.
Tags: iWork
Similar Questions
-
Overview of Sierra blacking out diagrams in PDF
When you view a PDF user manual, and some of the diagrams are blackened. Read properly user manual front of Sierra. A new pdf download does not help. The document is displayed correctly in SC6. All the patches?
Hi, Mike V Nano.
I see your message that your PDF document is not correctly displayed in the preview for macOS Sierra. I'll be happy to help.
As you notice this with several pdf files and these files seem to be display correctly in another app, looks like you have isolated this problem with preview more precisely. First, open preview and choose Exit in the application menu in the menu bar, or press command-Q to close the application. When you re - open preview, hold down the SHIFT key on your keyboard while you open the program. This will temporarily prevent the application to reopen his documents and its windows. A test to see if you still notice the same problem after you perform this step. If you haven't already done so, try to restart your Mac to see if the problem persists as well.
If the problem persists after trying the above steps, I would like for you to start in safe mode and test for the problem there. Take a look at the following resources for more information on this process:
Try safe mode if your Mac does not end commissioning - Apple Support
If the problem persists in safe mode, it may be a good idea to test this behavior in an another user account on your Mac. This will help you locate the problem. Take a look at this Web site for more information:
How to test a question in another account on your Mac - Apple SupportHave a great day!
-
I need to annotate the following table with the values in the column of the brand. I would like to a symbol appear for each date in this column. The values in the column of the brand are calculated simply by subtracting a constant from a date in the Date column.

Here's what it looks like if I try to include the column of the brand:

Any ideas how to make this work?
HI ' space,.
The chart you are using is a graph of the category. Cards draw one or more sets of values in a list of categories.
Your chart uses data listed in column A of the table (column heading) as labels for categories, spaced along the x-axis of the chart.
The values in column B (not a column header) are plotted against the y-axis.
When you add a second set of values to the table (in column (C), and then include this series in the chart, this series is added to the graph and the scale of the axis is automatically adjusted to account for these values (more on that below).
You will notice that the four values in this column are placed on the card directly above the values in the same row in column B. Each value in the same row is attached to the same category, and each category in the list in column A is assigned to a post also spaced on the x (x-axis).
Given that the values in column C are derived by "subtracting some constant of a date in the Date column' these values are also dates. If you want to note these dates on the x axis, the x axis should be a value axis, rather than a category axis.
Digit has two types of graphics plot values against values - the scatterplot and the bubble chart. The appropriate choice for this task is the dispersion diagram.
Category graphics take the line header and the column header labels.
Values for scatter graphs cannot be placed in the column header or header lines. So the first place, needing a change is the Table.
Click on any cell in column B (Delta) and press option + left arrow to insert a new column (non-en-tete) to the left of column B. Label the Date column and copy the dates in column A in this new column B. Note that these must be Date values and actual time, which can be formatted to display as those of the current column.
Columns B and C now contains the first set of pairs x - y for the new diagram. Column D (Mark) will contain the values of x for the second series. Add a new column (E) to the right of column D to hold the values of y associated with brand x values in column D. These values will determine to what extent above the x axis each mark will appear. With the current range of value y (43-104), you can consider placing these brands with a value of 38 next to each date in the column of the brand.
The result would be similar to this:

Kind regards
Barry
-
Hello
in fact I try to recover an old T1000SE of 1990. The laptop was still working until 4 years ago.
This days I tried to turn on the laptop but only the power led comes on and it starts.So I think the capacitors in power supply are old so I'll change them or any analog part (transistor, linear regulator) are damaged.
My question is: because no matter where I can get the diagram of the motherboard T1000SE?
Can someone help me?Hello Bix
You will be very happy if someone has any motherboard schematic for this good old classic. Also, try to contact Toshiba allow partner in your country. Maybe they can help you.
In any case good luck!
-
Toshiba LCD 8 "Panel - need pinout diagram
I bought this LCD monitor (part # LTA080B820A) precisely because he says that he has input RGB analog instead of digital inputs that accept most of the LCD.
http://www.geeks.com/details.asp?invtid=LTA080B820A&cat=MonNow, I need to find a pinout diagram that tells me what PIN does what on the input connector so that I can wire upward.
Someone at - it an idea where I can find a diagram pinout for her, or know a way to test the PIN.I thought since it is analog RGB, I should be able to solder a cable VGA to freeze, would this work?
Help if you can.
Thank you
-KrysHello
These manuals are not for the public, and I think you should get in touch with an authorized service provider. Here it s only a platform user and I doubt that you can get this information here.
Anyway, here you can search an ASP in your country:
http://EU.computers.Toshiba-Europe.com > support & downloads > find an authorized service provider -
hpe - 337C ww583aar wiring diagram
USB ports before damaging the USB devices. Suspect MB of wiring to the USB ports on the front panel, but you don't know where the riders should go.
MB has 6 positions labeled header - JUSB1, 2,3,4,5,6. JUSB1 & 2 seem to accept the connectors 1 X 5 or 2 X 5. JUSB3-6 accepts only 1 X 5 connectors.
Two front jumper cables have connectors 1 X 5. Pin 1 = red, 2 = white, 3 = green, 4 = black, 5 = white/matched.
Currently - the front panel low port USB is rider for JUSB1 (pine 1,3,5,7) & the USB ports on the front top of the page are related to JUSB2.
Sorry, but there is no wiring diagram. If the cable has a connector 1 x 5, the best locations to plug in the USB headers 3-6 East. If the cable has a connector 2 x 5, the best locations to plug in the East headers USB 1 & 2.
If you have any other questions, feel free to ask.
Please click the White Star of KUDOS to show your appreciation
-
HP Pavilion a1010n: wiring diagram
Where can I find a wiring diagram for my HP Pavilion a1010n? I took out the power supply to get a new and forgot where the wires go.
No matter what, it would help to http://www.playtool.com/pages/psuconnectors/connectors.html
-
Guy
Is there anywhere to download disassemble diagrams for the tecra and portege range or?
Thank you
Try Ebay.co.uk
Toshiba manuals
-
Re: Satellite A200: where can I get this adapter wiring diagrams
Hello
I would like to know where can I get adapter´s CA diagrams electric, because I have a Toshiba A200 1ts, it doesn´t work, I opened the adapater CA and saw a capacitor is burned but I Don t know what is its ability, so if you can provide me with the patterns, I would be very grateful.
My email is [email protected]
Thank you very much.
Hello
I doubt that you will get the electric diagrams for this adapter.
To be honest, I wouldn't recommend trying to repair the AC adapter if you have no knowledge and don t know what you are doing exactly.
The power adapter is really a sensitive part and a defective power adapter could damage the s for laptop mobo.
In your case I recommend spending a few bugs for a new good adapter before trying to fix something and run into the risk of damage to the mobo
Welcome them
-
Need diagram for Satellite 3000 601 PS302E-019R5-SP motherbaord
Help me please!
My laptop Toshiba Satellite 3000 601 PS302E-019R5-SP is attacked by a wet and when I clean it 3 components such as resistors and diode are broken
I need to shematheque (schema) motherboards to fix it.
Thank you very much!
Unfortunately I doubt that you will find these diagrams because these manuals are not published on any of the sites Web from Toshiba.
I don't think that the ASP (certified partner) might get such manuals.So either you seek in the net for these details or ask the ASP in your country for assistance.
Good luck
-
HP 8600 slow printing of diagrams and color photos
I have a desktop HP 8600 printer pro jet and it's very very slow at the color print and diagrams (colored or not). I aligned the printer and clean the print head but it is still slow and I mean slow 2 5 minutes from printing a page.
I also used the HP scanner/doctor and everything is fine with the printer is brand new.
Help, please!
Hello there bamitssam21,
Welcome to the Forums

I saw your slow printing problem you are having with your Officejet Pro 8600. I noticed that you have ran a print head cleaning, alignment and print and Scan Dr. indicates no error. There could be several reasons why slow printing occurs, the power of the printer for the program you are printing from (if the problem happens only in a single program) or even the pilot.
I'll give you some suggestions to try and I hope that we can get rid of this problem!
First, reset the printer and when you plug it back, just please make sure it is plugged directly into the wall socket. Avoid bars, surge protectors, nothing more.
This may sound weird, but sometimes it really helps and solves the problem.
Then, update the printers firmware: get the latest Firmware and product updates
If the problem persists, follow this guide for printing slow: slow printing
Good luck! I would like to know how to get you out, and if so, I'll help you gladly further.
Thank you
-
HP Pavilion p6210y wiring diagram
Need a wire diagram. Can anyone help please, so I can get my computer back? Thank you.
TSHelp wrote:
Power supply wire 9 and 10 uncertain who will drive optical and hard drive and wire 8 have no idea where he's going. If these feeds reader, you should be able to connect either one to each player. Normally, they are not designated for a specific drive. What type of wire connector 8 has on the end of it? The wire is actually marked by 8?
HDD to sata1 which is OK Yes, I connect usually the boot drive to SATA 1. This makes for less chance of problems.
the optical drive SATA 2 is only Yes good, that's what I'd do.
I think I have the rest of the wires correct.
I had helping hands during the cleaning of the Interior and they thought that move the wires out of the way was useful. Help or direction would be greatly appreciated. It is a lesson well learned. I always scored each wire with the connector to ensure that return them to their proper location.
-
Hello all,.
I have a beautifully SCB-68 connector block 68 pins. Can anyone provide me with the wiring diagram?
I went through the guides provided, but I have a few questions.
(1) how exactly work the switches?
(2) what is the need to provide + 5v to the part of conditioning of signals? (As for signal conditoning, we use some resistors and capacitors)
(3) where do we always connect us our signal? It is always the terminals screw or is it depends on the requirement of signal conditioning?
(4) if we use a conditioning of signals, which are input terminals? And what con terminals signals reaching data acquisition?
Concerning
-Vaidhin.
Hey,.
the Circuit diagram is shown to these PDF on page 82-83. (SCB-68 68-pin shielded connector manual user Block)
The sensor you want to use is never connect with the Terminal screw,
The switches have the following functions:
S1--> 5V supply
S2--> DGND
S3--> AIGND
S4--> PES or differential measurement
S5--> (cold junction Compensation) CJC
Best regards
Basti
-
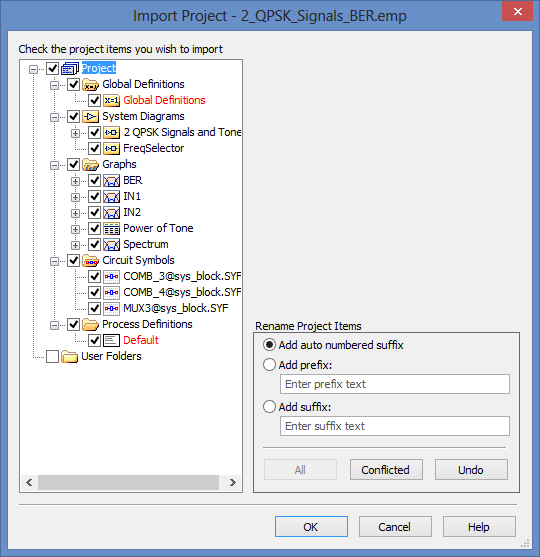
I have a project with many diagrams, graphics, Structures of the MA, user folders and etc. Is it possible next to copy and paste to move the items to another project?
Hello
Looks like you are trying to import all or part of a larger project into another project. In the AWRDE V10, AWR introduced "Import Project", a tool that allows you to do exactly this. To use the import project go to file > Import Project > and follow the instructions.
If you are using a version prior to V10, then the copy/paste method is probably the most effective.
Support of the AWR
-
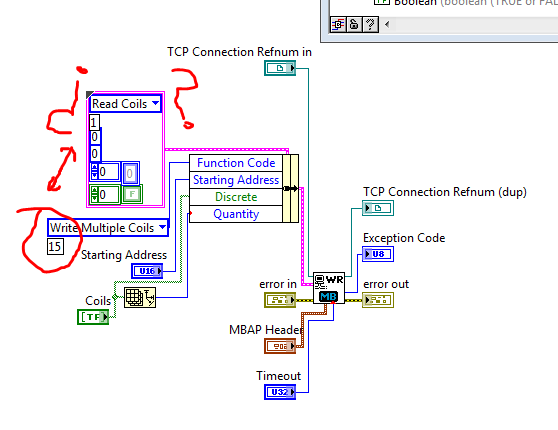
What this block diagram?
Match a VI Modbus Library. But I have because if the block is configured to write multiple coils in the coils because reading is set to 1?
All this work?
Sorry if the question is a beginner.
In this block diagram, 'Coils Read' and 'Write multiple coils' are enumerated values (or possibly ringtones of appeal, which is not serious for the purpose of this explanation). Enumerations assign names to numbers, to make them easier to read. The coils Read command is set to 1, the command to write multiple coils has a value of 15. You don't need to worry about this number, however, because the enumeration takes care of it for you.
The constant cluster containing coils of reading is there just to provide the correct data type (a cluster with the right items). Almost all the elements of the latter shall be replaced by the values of wired in the Bundle to node Name. For example, the value of reading coils is there as a placeholder for any function Code. the actual Code of the function is defined by plugging write multiple coils in Bundle by name.


Maybe you are looking for
-
It says protected (Q) and then when I click on it I get the error access denied message. I'm the only one who uses this computer.
-
It wont let me load Vista on the new hard drive
-
FM radio does not after update (23.4.A.1.232)
Hi, I have just discovered that after the latest software updated to the FM radio without working more. Have anyone summer another faced the same question? If something related to the last update of the software?Thank you guys for the support.Giusepp
-
What is "démo Mode" and "Quick Navigation" in HP DJ AI 5525
I use HP Deskjet Ink Adv 5525, to the Viet Nam. In the setting, the Preferences menu, there is a choice called "demo Mode". I could not find the documents on that choice. What is "demo Mode"? What is the mode "Quick Navigation"? Can not find them in
-
How to use core mediaplayer for YouTube videos?
Hi all I try to use the mediaplayer core to show a YouTube video. This is the code I wrote: MyApp::startYoutube (QString uri) {} InvokeRequest cardRequest; cardRequest.setTarget ("sys.mediaplayer.previewer"); cardRequest.setAction ("bb.action.OPEN");