Channel separation order waveform table parametricaly?
Hello.
I have an application where I gain two temperature & strain. The number of each type of sensors varies from one test to the other. I want graphic of each type on different graphics so that I can scale properly. I enclose a picture of my application.
Is it possible to control through front?
Say, using a digital command to set the number of strain gauges (first N channels are strain gauges, thermocouples of rest), then separate the data.
Thank you
Usuario
Hi user,
You can use the function split array.
Mike
Tags: NI Software
Similar Questions
-
Graphical representation of the different channels separately
I'm a VI design that acquires data from 3 different channels (voltage). The data from each of these channels must be converted separately (user-defined) in other quantities (say, pressure, temp and force). Am I voltage data acquisition and using the formula with coefficients powered by user to convert the data.
However, I would like to be able to store the data of the amd chart separately. In the above procedure, the signals of all channels are under conversion. I want each channel to undergo a conversion specific and graphic and store the data for each channel separately. How can I do this? Please suggest.
Thank you
Dheeraj salvation,
The order of the signal depends on the order of the DAQ chain that you configure. I think that the signal of channel (ai0) 0th will be available in the branch above the page which is the tension in your case.
You can mark it as a solution if your problem is resolved so that others can also get help on the wire later. Do not hesitate to ask if you have more doubts.
Kind regards
Amine31
(Bravo to give good answers, mark it as a Solution If your problem is resolved
 )
) -
With the help of StatBlockCalc on channels separated
I use StatBlockCalc on several channels to give me a new channel of all the minima of each channel in my DataSet. The call looks like this
Sun Dat
"Dat is used to set the list of channels when you don't know the number of groups
Dat = "" [1] / CH1_min'-' ["& GroupCount &" ' "] ' / CH1_min'" "Call StatBlockCalc ("Channel", "1-", Dat)
It works when there is only one channel in each group. However, I have now 2 channels in each group, and I need to create the new minima channel separately.
Any ideas how I can do a StatBlockCalc on separate channels in an undetermined number of groups?
In collaboration with one of application engineers, we came up with a solution. Basically, I'm building a chain of the CNo() of each of the channels I want and sent this string to the StatBlockCalc function. Works like a charm.
DAT = «»
For j = 1 to groupCount
Chnum = ONC ("[" & j & "] / Ch1_min")
If Chnum > 0 Then
DAT = Dat Chnum & & ''
end if
nextCall StatBlockCalc("Channel","1-",Dat) '... StatDirec, RowNoStr, ChnNoStr
DAT = «»
For j = 1 to groupCount
Chnum = ONC ("[" & j & "] / Ch2_min")
If Chnum > 0 Then
DAT = Dat Chnum & & ''
end if
next -
I can here sample 9215 channels separately sometimes differ by a few FPGA ticks?
Howdy-
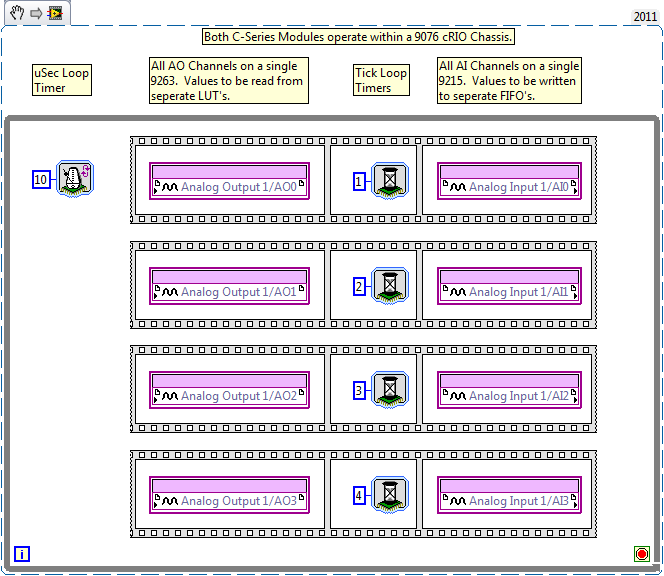
The image below is a raw illustration of my question. I would like to individually explain the delay between excitation and response of 4 separate systems, each connected to a single channel of a 9263 (excitation) and a 9215 (response). The minimum time of update on both modules is approximately 10 uSec, so I think it would work if I just wanted to read all channels to HAVE at the same time. However, I did not yet understand internals of the 9215 that enough to know if I can taste the individual channels separated sometimes by a few ticks to FPGAS.
Thank you all, and have a great day.
Hi, BCRO,.
With the 9215, all separate channels separated from a/d converters, but still work in the same clock 100 kHz (10usec) that the module is limited to this sampling frequency.
So, in your case (thanks for the picture, by the way - it is always useful!), what will happen is that all four of these input channels of the 9215 will take place on the next loop cycle instead of staggered in one iteration of the loop.
For example, if you were to use a loop rate (25 kHz) 40usec, you can compensate for these delays at intervals of 10usec and that this configuration works, but not as quickly as you want.
I hope that this explanation makes sense, but the short answer is that we will not be able to do so during the execution of the loop in the time of minimum cycle.
-
How can I set the time axis on my waveform table to show run time that is to say whenever I start the program I should have 0 as the starting point. I've been messing around with the without success. I'm under Labview 2012.
Thank you!
Townes wrote:
I can't understand what you mean. I have no formal training with labview. It took me a long time to write the simple program that I joined. Any guidance would be greatly appreciated!
Its pretty normal for a beginner to take the time to write code. Right-click the map of waveform > Create > property node > historical data, you will get a property node, keep this at the beginning of the code and create a constant. You can also go to the VI properties and > run and select "clear indicators when it is called.
I recommend you to go through the basic materials of LabVIEW which will give you an understanding on the basics of bases/components of LabVIEW.
-
HelloW,
I have a problem,
I table 1 d of string, I need string separated with zero table new value and that contains only values non-null,.
is it possible
Thank you
-
Control the properties of the graph of a waveform for waveform table.
I'm to customize a waveform graph. I will have no problem using nodes property to define all the things I need to (color plot, the names of axes, etc...). My wave form is actually an array that contains the seven waveforms. The problem is that the property of the waveform graph node changes only trace, legend, etc. the first signal in the graph. They all have the chart perfectly together. However, my application requires the user to be able to select say signals 2, 5 and 7 of the table. When it does, it receives signals of 2, 5 and 7 on the chart, but the legend Watch reports 1, 2 and 3 and they draw in the colours of the signals 1, 2 and 3. Any suggestions on the update of the properties of several plots of a waveform graph?
Also when I want 1 signal trace a curve of waveform. When I want the signals from 2 to 7, I have to draw a second copy of the curve of waveform. For some reason any a waveform table chart cannot double as a unique waveform graph. Any ideas on that? Thanks in advance for your help.
To change the properties of other signals in the chart, you will need to set the ActivePlot property node before writing the color, the name of legend, etc... To display only the selected signals, you could do a couple different things.
(1) set the color of the signals that are not visible by transparency
(2) write NaN values to the curve of waveform of the signal that you do not want to display
-
Having two channels separated by commas and try to insert into the table.
Hi, in my procedure there are two upcoming channels as separated by a comma.
Ex:
Channel 1: 1: a, 2, 3: c, 4:d, 5:e, 6:f, 7:g, 8:h, 9:i, 10: I;
Channel 2: 10: a, 11:b, 12:c, 34:d, 45:e, 112:f';
I have a table like this:
Now I want to break the chain that he insert the records as:create table temp_updrop (id number ,valto1 varchar2(10),valfrom1 varchar2(10),valto2 varchar2(10),valfrom2 varchar2(10));
Channel 1: 1: a, 2, 3: c, 4:d, 5:e, 6:f, 7:g, 8:h, 9:i, 10: I;
1 insert in valto1
an insert in valfrom1
2. insert into valto1
b insert into valfrom1
.
. so now
Second string
Channel 2: 10: a, 11:b, 12:c, 34:d, 45:e, 112:f'
10 insert into valto2
an insert in valfrom2
11. Insert in valto2
b insert into valfrom2
.
.
.so on.
The chain might have a number any of values separated by commas or null as well.
I started with something lie this but after that I don't know how any help appreciated!...
Thanks in advance!declare vtab dbms_utility.uncl_array; string1 varchar2(4000) :='1:a,2:b,3:c,4:d,5:e,6:f,7:g,8:h,9:i,10:j'; string2 varchar2(4000) :='10:a,11:b,12:c,34:d,45:e,112:f'; cnt number; begin dbms_utility.comma_to_table(string1, vtab, cnt);
Published by: BluShadow on 18-Sep-2012 15:28
fixed {noformat}{noformat} tags. Ensure you specify the word "code" in lower case in the tags.Glad I could help.
Please check the question 'answered' if it is. That helps others to focus on the outstanding issues.
-
Hi, I work with a USB 9162 NI and the NI 9234 4 channels daq, in LabVIEW 8.5. I am acquiring data from a device that produces a ~ square wave and I'm trying to determine and record the frequency of the square wave. The problem that I am currently is that the graphic waveform and table that are produced by the vi correspond. I recently hooked up to a generator of signals set at 500 Hz to a channel and checked against an oscilloscope. I get 500 Hz on waveform graph, but 605 of the table. The graph is truncated to 825 Hz in the x-axis and the 500/605 is ~ 0,825, the same proportion as the truncation/1000 Hz. I have attached the screenshots of the block diagram and front page. Any help to understand why this happens, and fixing it would be greatly appreciated...
Chuck Griesel
All, I got some very good information of Carmen Zheng concern why I saw a mismatch of the screen and writing table. This message was received after several posts back. I have attached the vi containing the solution, as described below.
Thanks a lot for your help!
_ the message _beginning
Hello Chuck,
Please send me this file. I've seen what happens.
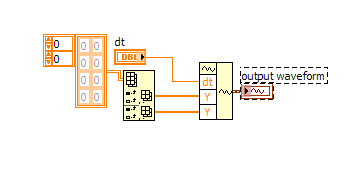
The dynamic data signal that you have acquired by the simulated signal or your hardware contains three components: Y, dt, t0. These components are required to create a waveform correctly. The
component is returned as an array of the values of the waveform and dt data returns the interval in seconds between data points in the waveform. The dt is Fs / #s, this dt value will be
indicate the waveform how to distribute the values Y on the x-axis.The reason of why you saw the incompatibility is that you check out only the component Y, which does not contain information on how to distribute it on the x-axis. The index of this item
does not reflect the position where the value must be shown.The workaround easier that I could find was to create an array with a size of #s, then insert the values in the table are component to the new array, but the index is climbed by the factor of dt.
Please take a look at the attached code.
Let me know if you need more assistance.
Kind regards
Carmen Chan Zheng
Technical sales engineer
National Instrumentsmessage___ ___end
-
Report: channel error in several tables description
I get several error messages when you create more of a channel table and you want to view the descriptions of channel. Is there something wrong with the allocation of the value of the description of the header line? I have attached a minimal example:
Option Explicit ' force explicit declaration of all variables in a script.
Call Data.Root.Clear)
Call DataFileLoad ("C:\Program Files (x 86) \National Instruments\DIAdem 2014\Examples\Data\Example_data.tdm")
Call Report.NewLayout)Dim oMySheet, oMyTable, oMyColumn, oMyGrp, iCount, gCount
GCount = 1 to GroupCount
Set oMyGrp = Data.Root.ChannelGroups (gCount)
Set oMySheet = Report.Sheets.Add ("Table" & gCount)
Set oMyTable = oMySheet.Objects.Add (eReportObject2DTable, "Table" & gCount)
oMyTable.Settings.Header.Title2 = "@Data.Root.ChannelGroups (CurrGroupIdx).» Channels (CurrChnNo). Properties ("& Chr (34) &"description"& Chr (34) &" ""). "Value".
oMyTable.Settings.Header.UseAutoFontSize = TRUE
oMyTable.Position.ByBorder.Bottom = 5
oMyTable.Position.ByBorder.Top = 5
oMyTable.Position.ByBorder.Left = 5
oMyTable.Position.ByBorder.Right = 5ICount = 1 to oMyGrp.Channels.Count
Set oMyColumn = oMyTable.Columns.Add (e2DTableColumnChannel)
oMyColumn.Channel.Reference = oMyGrp.Channels (iCount). GetReference (eRefTypeIndexName)
Next
Next
Call Report.Refresh)As you will see, everything works fine for the first table, but errors are produced for all of the following.
/ Phex
-
Hello
First of all, I use LV7.0. I pass data to a waveform chart. A two-dimensional painting converted to a cluster, and then passed to the table data. Graph properties are set to only show that a single conspiracy, but there is so many places on the map I can't make heads or tails of it. See attachment. Thanks for any help, as someone of you could provide.
What is the size of your cluster? That determines how many different parcels you have.
-
How to convert Brown waveform table Orange table
Hey,.
I'm trying my table in a box formla so I want the individual values in this table, but I never came across the Brown son of waveform
I have attached a file paint below, I hope that aid to explain what I mean
I want to go find the frequency & phase of my wave is it able to use thoes values in a calculation
Thanks, I hope this makes sense.
Resolved, regret that turns brown dotted line is a cluster not a waveform.
-
Hello, wolrd, another problem im stuck with this is: now that I managed, with the help of good people here, to pass successfully a desired of a servovalve voltage value, I need to arrange an entry which, in my case, two pressure sensors: one of them is implemented before the valve, another is after, so I plugged the two input channels , ai0 ai1 and and created two graphic signals to see the voltage on the sensors. the problem occurred is ridiculous: I have three loops: output (voltage servovalve) and two loops of entry for both sensors, where I added two charts, but when I run the program, one of the charts never work entry, so I decided to do the following: I changed the two graphs to display data from a channel, for example ai0 and its quite logical that it should have the same waveforms , haha not at all, on of them is always frozen. which of them? randomly. and I thought to a next thing: he really resembles the fastest access to the works of waveform graph, one loses the race and is frozen. What could be wrong? I did some tests, and it happens that a problem is not with the connection, nor with sensors. any ideas on that? Thank you

p.s. the vi attached
If the types are the same, simply "dev1\ai0:1". Otherwise, two functions DAQmx create channels wired in sequence.
-
Hello
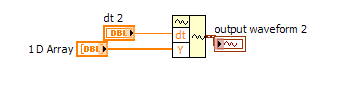
I'm working on a real-time application that adds a new table 1 d to all 2mS, which gives the 2D resulting. How can I convert this waveform 2D arry in a possible minimum period that the application has need of data online.
Thank you
Here is a way. You must add the sampling frequency of youer dt control and you may have transposed the data depending on how it is implemented. The other way would be to convert the 1 d arry waveform before Sane in a 2D array. Make rather a 2D waveform.
-
Download massive updated the planned orders in table msc_supplies
Hi all
I need your suggestion below requirement:
For item RM, we planned order suggested that the CPHA; before releasing it, we want to change Date of implementation and the amount of order, then output the last modified scheduled released automatically to create the PR in purchases & Payables.
In order to change the planned orders of RM, we export order planned the Workbench of the CPSA in the worksheet and then change dates, quantity, etc. in the worksheet. We want this change data to insert in the table msc_supplies automatically with manually intervene them and followed by releasing these planned automatically orders to create a PR
We want to know how to achieve this requirement. We want to know the available custom hook and script to insert record in to msc_supplies.
Have a great day.
Thank you
Sanngo
Hello
We expect steps below:
(1) export the planned RM command suggested by the CPSA to the spreadsheet or report.
(2) prepare the csv file with mandorty field as shown below in the table, i.e. date, quantity, etc. and format the data according to the custom intermediate table created.
(3) custom concurrent requests created, which is used to locate the data file and upload the data to a custom intermediate table.
(4) of the intermediate table that we are download the same data in the database MSC_SUPPLIES table (make a validation here check) in the same program. After that a manually scheduled commands added to the table of MSC_Supplies and can be found in the CPSA workbench.
(4) in the same concurrent application of custom, call "automatic rejection" to release these records of the base table of msc_supplies, where release_flag a value of 1.
We want to know the required fields need to be updated in the staging table custom and the base table:
ORGANIZATION_CODE
ORGANIZATION_ID
ITEM_SEGMENTS
INVENTORY_ITEM_ID
ORDER_TYPE_TEXT
ORDER_TYPE (5)
New Date
FIRM_DATE
New quantity
FIRM_QUANTITY
Argument Plan_ID
Transaction_id
RELEASE_STATUS (1)
SR_INSTANCE_ID You can test adding the manually planned adhoc decrees on Workbench CAWC namely, which are updating fields in the MSC_SUPPLIES table.
Have a great day.
Thank you
Sannago
Maybe you are looking for
-
HP 2000-2061TU: How can I upgrade my graphic card in my laptop and my model number is hp 2000-2061TU
How can I update my graphic card in my laptop? and my model number is hp 2000-2061TU Please help me...
-
Frozen laptop to "install updates 1 of 1.
I have a laptop Acer 5542 6 months old. In the last month, I got the blue screen twice, and I have no idea why. The laptop has been hot, is it possible that? I have now bought a laptop to computer has hope that was the least of my problems. Apparentl
-
Error message: "Please ensure it is a valid path; and you have access sufficient. " I am system administrator. I'm on a Gateway laptop.
-
I think that I mest upward to my lap top
I can't play music on itunes, it doesn't let me do the updates because it says the service his does not not and won't let me put my malaware protection and many other things... I think it's all the becaused started, I installed wisefixer and it asked
-
8600 Officejet Duplex Scan and Eprint
I have a question on the HP Officejet Pro 8600. I have a Mac and Mac OS x installed Lion: (1) how to scan HP scan3 2sided/duplex? There is no option to choose to scan duplex, I have installed duplex accessory and I checked in the system Prefereneces