Draw date
HelloOracle 11.2.0.1
Windows xp
Is it possible to convert dates comes out like this:
01/01/1982 should be January 1, 1982
01/02/1983 must be January 2, 1983
02/03/1984 should be on February 3, 1984
03/04/1990 should be March 4, 1990
04/05/2000 should be fifth April two thousand
05/06/2001 should be sixth may two thousand one
...
...
I read different links for this information
Select to_char (to_date(12345,'J'), 'Jsp') of double;
and HOW TO: a number fate or to convert a number into words
But I am not able to convert the date speaking of words. I mean there is a function in which I'll call a secondary function and then that would work something like this:
Select double myfunction('01/01/1982'); and it returns the string based on the NLS_DATE parameter like this:
January 1, 1982
I'm sure that the question has been asked, but not finding the link, kindly help me for the creation of a link or function please.
We do not pronounce the 1981 as a thousand nine hundred ninety eleven, but they say Nineteen Eighty One, if a little complicated for me. Getting the name of the month is easy:
Select to_char (sysdate, 'Month') of double; but 31 days as first, second, third, fourth, fifth... Twenty-ninth, thirtieth, thirty and the year was difficult for me.
Thank you.
user12050217 wrote:
Kindly help me.
Subtract 100 years (1 200 months) from date and use century format (CC):
with sample_table as (
                      select to_date('01/01/1982','dd/mm/yyyy') dt from dual union all -- should be First January Nineteen Eighty Two
                      select to_date('02/01/1983','dd/mm/yyyy') dt from dual union all --  should be Second January Nineteen Eighty Three
                      select to_date('03/02/1984','dd/mm/yyyy') dt from dual union all --  should be Third February Nineteen Eighty Four
                      select to_date('04/03/1990','dd/mm/yyyy') dt from dual union all --  should be Fourth March Nineteen Ninety
                      select to_date('05/04/2000','dd/mm/yyyy') dt from dual union all --  should be Fifth April Two Thousand
                      select to_date('06/05/2001','dd/mm/yyyy') dt from dual           --  should be Sixth May Two Thousand One
                     )
select  replace(
                case
                  when dt >= date '2000-01-01' then to_char(dt,'fmDdthsp Month Yyyysp')
                  else to_char(add_months(dt,-1200),'fmDdthsp Month Ccsp Yysp')
                end,
                '-',
                ' '
               ) splelled_dt
  from  sample_table
/

SPLELLED_DT
-------------------------------------
First January Nineteen Eighty Two
Second January Nineteen Eighty Three
Third February Nineteen Eighty Four
Fourth March Nineteen Ninety
Fifth April Two Thousand
Sixth May Two Thousand One

6 rows selected.

SQL>
SY.
Tags: Database
Similar Questions
-
Anyway do not draw data points as nodes on a line chart?
I have no use for the each data point = function node on my chart, and I suspect that's the reason why in my application performance is very poor. I have a line chart which can be composed of several hundreds, or even thousands, individual data points----> I can not afford to draw a node for each of these points when he didn't need to do. I just need the line between the drawn points.
A quick ogle at the JavaDoc reveals no obvious way to do it. I can remove the Visual effect in CSS - and I have - but the nodes are still created.
How can I prevent the JavaFX creating a node for each point?
I have the same problem: try to use
lineChart.setCache(true);
lineChart.setCacheHint(CacheHint.SPEED);
This should speed up your data series
-
How to maintain the consistency of data of continuous report during data loads?
Hi all
I have a few reports that draw data from data on sales, and this mini mart - data warehouse is responsible for hourly and my report has to show data updates... it that changes necessary config that I have to do in the RPD to make reports to obtain the most recent data?
Thank you
DKDK... The imp thing, you need to take care is to disable the cache, or purge the memory cache after each load by using the method of pooling of events. This will ensure that you see the most recent data and data not expired.
Hope this helps
-
How to simultaneously update multi field (chart wpf)
How to use several piece add simultaneously data?
For example, there are 18 parcels of graph. The Datasouce of the graph is ChartCollection
graphds [18] It should run 18 times to APPEND to update the whole graph.
Code:
APS [0-17] = graphds [0-17] .append
Dispatcher.BeginInvoke (aps, simulatedData) / / run 18 times
I hope that there is similar data
graphds. Append (datasources Point [18])
who can cool 18 draw data simultaneously.
complete code to testmultiplot.zip
Thank you
The types of specific elements involved aren't important. The idea of the
AppendAllhelper function is just to have a single method to perform all work to append, rather than citing for each separate addition. You can also set the programme of assistance generically and use any type of data for the items:private static void AppendAll( ChartCollection [] charts, IList [] values ) {
for( int i = 0; i < charts.length;="" ++i="" )="">
charts[i].Append( values[i] );
}
} -
How to trace datetime against temperature table of waveform
Hi guys,.
I try to draw data from my table and to draw a time value date on the x axis and the value of the temperature which resemble 32.5 c
on the y axis on a cat of waveform. I'm new to studio measure, anyone have an example on how to proceed?
I have a loop that loop and gets the data from each row (time and temperature) and I want to draw in each loop, I leave,
If the graph will be a building, and the user can see until I read all the records.
Hi lil_racoon,
Thank you for the additional information. After looking at what you're trying to do, I think that the enclosed code will achieve your goal. Try to adapt it to the work of your application.
Thank you
-
Local Variable is NOT being updated?
Hi all
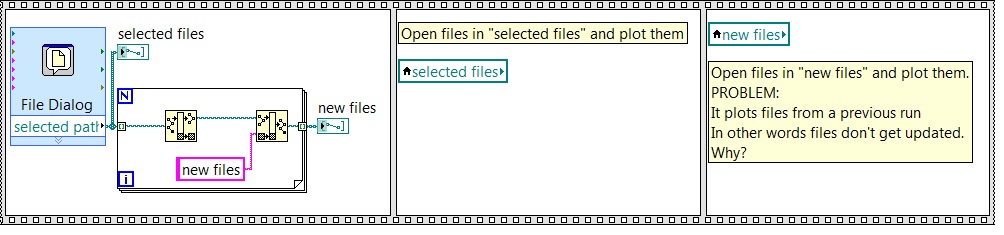
Please see the attached picture for the problem that I am facing. Basically, I want to open multiple files in a folder and file names allows you to derive the other names of files in a different folder and plot the data in all the files.
Here's what I do:
1. use the file dialog box to select files
2. create a local variable to 'selected files' - see below
3. derive from new files "new files" using the "selected files" and make a local variable of the "new files".
4 plot data of "selected files".
5. Drawing data from the files of 'new '.
The reason for the local variables is that I will access files original and derived from many places in my VI and I want to avoid the eternal wiring or by opening the file several times dialog box (less clicking - my figure of index hurts
 )
)Problem: Data from "selected files" get traced. However, given "new files" are NOT given in the 'new' files to run it, but run a previous data. Apparently, the local variable "new files" does not get UPDATES
with the "new files" of the current run. I have to run my VI twice. Why is this? How can I solve this problem?
-
Don't have microsoft run a 25th anniversary contest? I'm a winner? or is it just another scam.
I received this email from "Microsoft Windows"<*** email="" address="" is="" removed="" for="" privacy="" ***="">
You emerged winner of last weeks draw. Contact with your; Name;
Address; Mobile telephone number; Occupation; Age;Name: Mr. Micheal Smith
E-mail: * e-mail address is removed from the privacy *.
Phone: + 44 7045711283Win more details,
Amount earned: £1 000 000 GBPThe draw date: March 1, 2011.
The office of the Registrar,
---------------------------------------------------------------------
Provided by NuNet, Inc. Web mail. The National supplier of the Prime Minister.
http://www.NNI.com/It's a scam. Microsoft will never contact you unless you tell them (even in this case, it is unlikely).
-
Array of strings to waveform curve
Hi all
I use LabView7.0 and need to trace the channel data on the waveform graph. I fix the image of the table that contains the data. The table or the data in a table is of type string, he got the date, time, and data from all 16 channels at that time. My requirement is to draw date hour n of all folders on the x-axis and its corresponding value in the chain on
y - axis graphic waveform.
.
Kindly give me example code and brief details to develop the same otherwise, I will be stuck in a large
mess

Kind regards
John
-
Black lines on 3D surface plot
Hello, all!
In my current application, I have a 3D surface chart on which I draw data of power spectrum in a waterfall display. I did some structural changes to the program; the data passed to the chart values are the same. Now all I get are black lines across the plot, and it seems to slow my program as well. The surface chart worked before, but it displays these symptoms after a system failure. I deleted the original, thought control, it could have been corrupted somehow, but I still see the problem on the new graph. Can someone tell me what could happen?
Thank you!
P.S. Is this normal, not being able to drag and drop a container to ground through a front 3D ActiveX?
SLOWPOKE,
Offer useful suggestions is tricky because I can't find a way to reproduce the behavior you describe. I guess we're free Gremlin here in Austin.

I guess you want to verify that you are not modified the properties of axes anywhere in your code. There is a VI called Properies Axes, allowing you to programmatically set the property Auto scale for each of the axes in the 3D graph (graphics and sound > properties of 3-d chart). You can play with these settings. In LabVIEW 8.6, in fact, this property is extended to include a programmatic framework of values max and min for each axis. There was a lot of functionality added 3-d chart; If you often use these graphs, you can look into an upgrade.
-
Address Book Outlook 2010 only appear not
My outlook address book is empty when I click the To: button. This despite that the contacts are there in the contacts tab or folder, whatever you want to call it. This also affects my ability to send messages using contact groups, as they only appear in the address book. I can't create a new group in the contacts folder, because it opens an empty address book.
Things I've tried:
- I created a new profile from scratch and chose this profile because I read that one on Microsoft support
- I tried to import my list of contacts to a saved csv file previously because at first I thought that something happened to contacts
- I tried to run the repair function to my Outlook application from the control panel
- I run scanpst on the pst files.
I don't understand the relationship between Outlook Contacts and the address book I think that draws data from contact in the contacts and/or suggested contacts folder, everywhere where it is stored. I don't want to create new if possible pst files.
I don't know if I was attacked by some piece of malware, but increasingly this problem, my copy of Google Chrome can not access this site. I got a useless error message saying 'something was wrong and we cannot connect you right now. Please try again later. »
I use Internet Explorer now.
Hi Henry,.
Please contact Microsoft Community. I will surely help you this question.
Try the steps listed here:
(1) to troubleshoot issues related to Microsoft Outlook 2010, I suggest you send the request in the following link.
(2) to check if the computer is infected with the virus, I suggest you use Microsoft Safety Scanner.
The Microsoft Security Scanner is a downloadable security tool for free which allows analysis at the application and helps remove viruses, spyware and other malware. It works with your current antivirus software.
http://www.Microsoft.com/security/scanner/en-us/default.aspxNote:
(1) the Microsoft Safety Scanner expires 10 days after being downloaded. To restart a scan with the latest definitions of anti-malware, download and run the Microsoft Safety Scanner again.
2) if you run the virus scan of the program which is infected with the virus will be deleted. Therefore, reinstall the program. Also, if files and folders are affected by the virus, while they might even get deleted.(3) to resolve the problems with Google Chrome, I suggest you contact the Support of Google Chrome.
https://support.Google.com/chrome
Hope this information helps. Reply to the post if you need help or information on this issue.
-
Since data is stored outdoors, and the definition that is stored inside, it means that a the table structure of the outer table is stored in the database as well (or a virtual table based on the definition of the external table...)
I'll hit the ORA-DOCS again once, back in the external tables read tonight on them 2 or 3 sources and it is not quite clear whether real data with structure exists outside the database or an internal table set (and stored) retrieves data from an outside source.
Since data is stored outdoors, and the definition that is stored inside, it means that a the table structure of the outer table is stored in the database as well (or a virtual table based on the definition of the external table...)
The 'definition' you refer to IS the structure of the table; they are one and the same. There is no 'table' stored in the database using space or storage. When a query on an external table is executed, the data source is read.
I'll be hitting the ORA-DOCS up again, just got back into external tables tonight reading up on them from 2-3 sources and it is not quite clear if an actual data with structure exists out of the database , or an internally defined (and stored?) table draws data from an outside source.
I suggest you that start with the documentation of Oracle - including the ground provided the link to:
If any "metadata" are stored outside the database depends on if the file that is outside of the database was produced by Oracle using the robot UNLOADING discussed in this doc
Unloading of data using ORACLE_DATAPUMP Access driver
To unload data, you use the
ORACLE_DATAPUMPdriver access. The stream that is discharged is in a proprietary format and contains all of the data column for each row being unloaded.A discharge operation also creates a stream of metadata that describes the content of the data stream. The information in the metadata stream are required to load the stream. Therefore, the metadata stream is written to the file data and placed before the data stream.
If YOU provide data/files, then you MUST provide it in the format expected by the external table statement. You can, if you wish, use a preprocessor to convert ANY file (zip, encrypted, etc.) in the required format.
For YOUR files, you can the metadata stored in the same file, or elsewhere, if you choose, but Oracle will have NO knowledge of this fact and not will NOT be involved in the transformation or read any of the metadata that you provide. Your preprocessor must remove all these metadata and ONLY provide data in the format appropriate for Oracle to use.
If the file was produced by the process of UNLOADING Oracle then it will include metadata that Oracle WILL read, use, and remove as says this quote from doc above. These external metadata is added to the real external table definintion/metadata stored in the dictionary.
-
With the help of APEX_JSON translated by JavaScript and escape the quotes
I am currently generation JSON using the APEX_JSON package. It works fine, but I got out the JavaScript code on the loading of the page and can not find a way to escape the double quotes.
function drawChart() {


        var jsonData = &P9_JSON.;


        var data = google.visualization.DataTable(jsonData);


        var options = {
          title: 'Test Chart',
          pieSliceText: 'value'
        };


        var chart = new google.visualization.PieChart(document.getElementById('piechart'));


        chart.draw(data, options);
      }
I'm getting errors because "is replaced by & quot;" in the javascript code generated. Any ideas how to replace these? I tried to use to replace them, but it doesn't seem to work...
Thank you!
Hi LSDev
Replace this line--> var jsonData = & P9_JSON. ;
To--> var jsonData = & P9_JSON! RAW. ;
This work for me...
Best regards
Eduardo
-
Want to combine the two queries
Hello
It is my first post here, I hope it's a good place to put it.
I have two queries that both gave me the results. I guess that both are way more elegant or better to do what they do, but that's what I came with. So feel free to modify them. However, my real problem is I want to combine these two queries in a single query, removing duplicate information.
analytical_query
SELECT * from(
  select
  requisitions.acc_id AS "Accession #"
  ,requisitions.draw_date AS "Draw Date"
  ,requisitions.received_date AS "Received Date"
  ,req_panels.run_date AS "Run Date"
  ,tests.TEST_ID
  ,(CASE WHEN tests.TEST_ID IN (7101) THEN results.RESULT_NUMERIC*2
         ELSE results.RESULT_NUMERIC
   END) AS RESULT_NUMERIC
  ,doctors.f_name || ' '|| doctors.l_name AS "Physician"
  ,organizations.state AS "State"
FROM requisitions

inner join req_panels ON requisitions.acc_id = req_panels.acc_id
inner join results ON req_panels.rp_id = results.rp_id
inner join tests ON results.test_id = tests.test_id
inner join doctors ON requisitions.doc_id1 = doctors.doc_id
inner join organizations ON requisitions.org_id = organizations.org_id

WHERE requisitions.DEL_FLAG='F'
     AND req_panels.DEL_FLAG='F'
     AND results.DEL_FLAG='F'
     AND req_panels.PANEL_ID IN (7000,70001,70551)
     AND results.TEST_ID IN (7101,7102,7107,7108)
     AND requisitions.RECEIVED_DATE > TO_DATE('9/1/2013', 'MM/DD/YYYY')
ORDER BY requisitions.ACC_ID
)

pivot(
      MAX(RESULT_NUMERIC)
      for TEST_ID IN ('7101' AS CRP,'7102' AS Hemoglobin,'7107' AS "LDT Run 1",'7108' AS "LDT RUN 2")
)
culture_query
SELECT * from(
select
  requisitions.acc_id AS "Accession #"
  ,MAX(requisitions.draw_date) AS "Draw Date"
  ,MAX(requisitions.received_date) AS "Received Date"
  ,MAX(req_panels.run_date) AS "Run Date"
  ,tests.TEST_ID
  ,LISTAGG(results.RESULT_ALPHA, ';')
  WITHIN GROUP
  (ORDER BY results.RESULT_ALPHA) RESULT_ALPHA
FROM requisitions

inner join req_panels ON requisitions.acc_id = req_panels.acc_id
inner join results ON req_panels.rp_id = results.rp_id
inner join tests ON results.test_id = tests.test_id
inner join doctors ON requisitions.doc_id1 = doctors.doc_id
inner join organizations ON requisitions.org_id = organizations.org_id

WHERE req_panels.PANEL_ID IN (7000,70001,70551)
     AND results.TEST_ID IN (10010,10052,11010)
     AND requisitions.RECEIVED_DATE > TO_DATE('9/1/2013', 'MM/DD/YYYY')
     AND requisitions.DEL_FLAG = 'F'
     AND req_panels.DEL_FLAG = 'F'
     AND results.DEL_FLAG = 'F'
     AND req_panels.RUN_DATE is not null
group by requisitions.ACC_ID, tests.TEST_ID
)

pivot(
      MAX(RESULT_ALPHA)
      for TEST_ID IN ('10010' AS "Organism",'10052' AS "Negative/No Growth", '11010' AS "Growth")
)
Basically, what is missing from the first query is the global list of the 'RESULT_ALPHA' for 'TEST_ID"10010, 10052 and 11010 numbers. And because of the way they want to view this information that I had to tilt it, which is where I ran into problems. If anyone has any idea on how I can combine these two requests and make them more effective that would be great.
Thank you.
Hello
JayG30 wrote:
... I have however found a way to do what I would call "swivel conditional." ...
I think it's the crux of this problem; you want MAX BOF a few tests and LISTAGG for others. I don't know a good way to attract the SELECT... PIVOT to do both at the same time. I think it's one of those situations where SOME... PIVOT is not the best tool for the job; MAX (CASE...) and LISTAGG (CASE...) may be more practical and more effective:
SELECT rq.acc_id
, MAX (rq.draw_date) AS "the draw Date.
, MAX (rq.received_date) as BEING "received Date".
, MAX (rp.run_date) AS "Date of the race.
, MAX (CASE WHEN rs.test_id = 7101 THEN rs.result_numeric * END 2) AS the crp
, MAX (CASE WHEN rs.test_id = 7102 THEN rs.result_numeric END) AS hemoglobin
, MAX (CASE WHEN rs.test_id = 7107 THEN rs.result_numeric END) AS "LDT Run 1.
, MAX (CASE WHEN rs.test_id = 7108 THEN rs.result_numeric END) AS "LDT, 2nd round.
, LISTAGG (CASE WHEN rs.test_id = 10010 THEN rs.result_alpha END)
, ';'
) Within GROUP (ORDER BY rs.result_alpha) AS "organization".
, LISTAGG (CASE WHEN rs.test_id = 11010 THEN rs.result_alpha END)
, ';'
) Within GROUP (ORDER BY rs.result_alpha) AS a 'growth '.
, LISTAGG (CASE WHEN rs.test_id = 10052 THEN rs.result_alpha END)
, ';'
) Within GROUP (ORDER BY rs.result_alpha) AS 'Negative/No growth '.
Rq requisitions
INNER JOIN req_panels ON rp.acc_id = rq.acc_id PR
INNER JOIN results rs ON rs.rp_id = rp.rp_id
WHERE rq.del_flag = 'F'
AND rp.del_flag = 'F'
AND rs.del_flag = 'F'
AND rp.run_date IS NOT NULL
GROUP BY rq.acc_id
ORDER BY rq.acc_id
;
I don't quite get the results you have posted; for example, I don't see how you get a row of results with 'Accession' = 142425, while acc_id does not occur in the sample data. It was maybe just a typo.
-
Dear God help me! Why Adobe should turn PhotoShop into a one-program-fits-all solution?
Hi people,
It is a form of cry a hole deep enough... I am a professional Retoucher and Artist/Illustrator... Not to boast or waving for attention here, but I spent the last two decades at the top of my game, where using photoshop is concerned, but it seems that this comfort zone is over... I'm drowning my beloved software turned to quicksand under my feet. The very foundation of my professional knowledge has turned to despair because I don't know what to do about this!
I was silently dying for about two months now after having upgraded from CS3 using CS5... Whenever I update, I roll with the punches. There are sometimes good things, but especially now, professionally speaking, the bells and whistles just weigh down me. Adobe moves the goal post trying to respond to casual users, while undermining the elegance of the function first in the program.
The question that started me here today is, "removal of pixels" using the "Delete" key when in quick mask, it's driving me crazy...
PLEEEEASE someone tell me how to disable the 'fill' dialog that appears whenever I press the DELETE key (when I'm in the quick mask). I want to just delete the "background color" (as I've done since the beginning of time) without the dialogue that adds a new step in the process... It used to be that if I wanted a 'dialogue', I simply press 'shift + delete' (which was a PERFECT solution when I wanted more options), but now this 'shift + delete' is the default position and I don't know how to get around to keep my workflow simplified as possible... Time is money, and the madness at work is a bitter reward for the upgrade of a piece of really professional software.
I ask Adobe, why trouble what is not broken? ... It used to be perfect... NOW I have 20 YEARS ' worth of reflexive habit creating anxiety in my workflow whenever I now try to use this database functions. It is amazing to be honest. I'm using Photoshop since version 2.5, and the point is that I used to use all Adobe graphics software programs in a concentrated state of MINDLESS... it's to say, ' without thinking '. But no more...
What's with the constant will to these things too? Once the most elegant of all the software programs (even means Adopbe Illustrator, which reached its peak at version 6), using Photoshop today reminds me heavy Corel Draw dates back to 1989, which was so big and horrible compared to the 2 Illustrator and photoshop 2.5 in those early days... Once upon a time, you knew what the program was, and you know what you had to do the work GET done using the tools available. Now, instead of using the full extent of the program and all these "benefits" I ignore a large part of them, coz they mess HALL added things...
I want the simplicity of 'form follows function' in the software...
I have to ask, what's with the new 'zoom' in the PS that doesn't work the same way in other CS5 programs, which are the same as the older versions? ... It is not a bad zoom, actually it has its strong points when you used to, BUT, there is a deployment ridiculous, half-baked idea that should have been implemented across the entire suite programs prior to release. Now, I am suffering between the new zoom jerk in the PS and the traditional zoom (perfect condition) which remains in Illustrator and indesign. It's like having someone cut the grass unless you walking along minding your business.
You want to work with 3D? ..... Why not use a 3D program dedicated to who will do the job properly and leave the retouch editing tool... I want just a chisel which has a 'Blade '... I have need a tracking radar garnished with x-rays that also allows me to see through walls when firing grenades at my woodwork. ALL I want is hardened steel, and a solid feel in my hands... The program to weaken the bells and whistles in PhotoShop. ..... . WHAT the hell is the 3D feature in Photoshop for? ... Abobe should bring back Dimensions (since nothing they have done since the abandonment of this program can hold a candle to the functionality of this EXCELLENT program niche) for TRUE 3D construction and rendered in postscript format.
With extensive experience and skills in reference is now an inflexible "rod" down my back, when it comes to this new version. It feels like 20 years of competence goes in the toilet. And for what gain for the serious and capable user? Software and interface additions that undermine the essential power of these once wonderful programs to work effectively, is finally bold and a burden that the software itself does not have to bear.
Does anyone think this way? Is what someone else frustrated by the bells and whistles overbearing? In my humble opinion, Photoshop has turned to sludge. Try to be all things to all people might expand the market and sell licenses, but she leads me into the wall on a daily basis... Maybe I'm just too old, but I want to get out the tools now...
Someone please give me and answer this riddle of 'remove key '... I'm going to lose my mind do my 'job '.
Thanks in advance.
Sincerely,
Charles
Post edited by: blackdog667
Regarding deleting key bringing up the dialog box to fill (this happens only on a layer of background BTW) - the development team implemented this way to allow the discovery of the user of the Content Aware feature - which is what you want to use for most users, when you delete a part of an image. In earlier versions of Photoshop, the delete key was located to "fill" will be background color (this also only occurs on a background BTW layer) for which he was already a shortcut (cmd + delete) who loses his reason makes the shortcut [Remove].
Zoom behavior change was also a case of discovery of the user. It is in fact fairly intuitive if you're not used to the way inherited from the zoom. The key is to understand how the new behavior.
Activate the zoom by clicking on the area you want to zoom in on and hold down the mouse button. When you drag to the right, you zoom in on the point where you clicked initially. When you drag to the left, zoom you out to the point where you clicked initially.
If you decide that you still prefer the old behavior, you can disable the new behavior by selecting the Zoom tool and unchecking 'Scrubby Zoom' on the toolbar options.
As pointed out by other users, it seems that you need to update your OS and Photoshop with the latest updates.
Photoshop to keep updated: http://adobe.ly/PS-Up-To-Date
-
How do you get listData to a DataGrid itemRenderer?
I want to do simple reusable components in .mxml use in my dataGrid classes. I don't want to specify the data field because I could use the same rendering engine of several columns in the same grid (for example a converter box) and I don't want to make several identical components whose only difference is the value that they draw 'data. To do this, I need to access "listData. Specifically listData.dataField. According to the docs, I need to implement the mx.controls.listClasses.IDropInListRenderer. I tried the following in my mxml code:
< mx:Component id = "reusableEditor" >
< mx:HBox implements = "mx.controls.dataGridClasses.DataGridItemRenderer" >
import mx.controls.dataGridClasses
.. content and display logic data [listData.dataField]...
< / mx:HBox >
< / mx:Component >
"I get an unnecessary error in Flex Builder, saying that"an internal build error has occurred"and only guess now that it is the 'implements ="mx.controls.dataGridClasses.DataGridItemRenderer' line ' (when I delete this line, things work very well). I have not found anywhere to check if I implement this correctly because there is not an example of work that does what I want to do - even if I use DataGrid 100's of times more often than any other list class! The example of TreeRenderer later in the docs is the only code addressing this issue, but it is a class AS that does not (as far as I can tell) a container such as HBox and doesn't implement any interface.
Just how can the question, I have access to listData?the
I finally understood what the ambiguous compiler error means... I had not implemented the functions required for the interface. Here is the working code that is declared as a component internal or external .mxml file displays the value of the column without explicitly defining what is this value.Although this component is very simple, it was very difficult to understand how to implement documentation... I hope someone from Adobe takes note.
[Bindable]
public var dp:Array = [{num:2, bool:true}, {num:3, bool:false}];
]]>
Import mx.controls.listClasses.BaseListData;
Import mx.controls.dataGridClasses.DataGridListData;private var _listData:DataGridListData;
[Bindable ("dataChange")]
public function get listData (): {BaseListData}
Return _listData;
}public function set {listData(value:BaseListData):void}
_listData = DataGridListData (value);
}override public function drawFocus(focused:Boolean):void {}
check.setFocus ();
}override protected function updateDisplayList(unscaledWidth:Number,_unscaledHeight:Number):void {}
super.updateDisplayList (unscaledWidth, unscaledHeight);
If {(super.data)
var dgListData:DataGridListData = DataGridListData (listData);
for some reason, setting check.selected here translates into behaviour bug
Check.Selected = data [dgListData.dataField];
}
}define a getter based on the "dataChange" event seems to update the value of the checkbox correctly when
clicked, decreed, sorting, etc...
In addition, doing it this way avoids those annoying "data binding will not be able to detect changes... blah blah"
[Bindable ("dataChange")]
public function get val (): Boolean {}
Return Boolean (data [_listData.dataField]);
}]]>
If anyone has any suggestions or comments, please let me know... I'm still trying to figure the best way to do it.
Maybe you are looking for
-
Why songs aren't grayed out after payment of the subscription?
last week, I was able to perfectly good music all songs were available, now today after membership renewal, a lot of songs I had played only yesterday are now grayed out, and all I get is a message of THIS SONG is CAN NOT BE PLAYED. What is going on?
-
programming for PXI-6071e with SCXI1125
Dear all, I connected the SCXI-1001 chassis with card Conditioning SCXI-1125 and SCXI-1327 block with PXI-6071E PXI-8176 with SH1006868 cable controller card. I chose the SCB-100 for PXI-6071 accessories, as there is no option to select SH1006868. I
-
First of all, what is a codec exactly? When I try to convert a file Mp4 WAV it tells me this (we'll use EA for example.): This file C:\Documents and Settings\Penny\My Documents\mp4\Emilie fall - 306.mp4, cannot be imported, please install the correct
-
Hello! I am facing a problem (attached image) with upgrading my router firmaware that I downloaded from the Web Site of Linksys. My laptop was connected to the router. Kindly help me. I have attached the image of my router for details. Thanks in adva
-
For about a week now that I get a lot of 'freeze' and try to eliminate contradictory processes that cause my Vista Home Premium 32-bit w / SP1 system to "lock" onto me. I tried but can't do a restore effective because none of my points of store go ba