How to generate a sine wave of table of values?
I have an array of points (values) around 1000. I want to draw them in different types of waveforms - triangle, sine, cosine, etc..
How ca I do that? For the waveform of triangle, I was able to split my table into 2 halves equal and draw the first half and the separately half second to generate a waveform of the triangle. But how to sine, cosine, Sawtooth etc.? It is a matter of urgency. Prompt response will be appreciated. Thank you
Hello
The VI in math palette is a polymorphic, it accepts the input also array.
attached a VI for your reference.
VI generates 1000 randon numbers and trace the sine and cosine wave.
Tags: NI Software
Similar Questions
-
Continuously generate a sine wave
Is there a way to generate a waveform in Labview without user input to stop it permanently? All shipping LV examples require the user to press a button to stop. I need to automate that in Teststand.
I want to:
Step 1 - generate a sine wave continuously
Step 2 - make a measure
Step 3-stop the waveform started step 1
Thank you
Never mind... I thought about it.
-
How to make a sine wave with a series of spherical objects (symbols of Yin/Yang)?
How to make a sine wave with a series of spherical objects (symbols of Yin/Yang)?
Do the yin/yang. Shift drag a copy some distance away. Create a blend between the two stages specified. Draw another line. Use the effect > transform > Zig - Zag with enough height and number of steps and smooth anchors. Expand the appearance of the effect. Select the mix and the wide range and the object > blend > replace Spline.

-
How to display different sine waves in a table and do a fft of these and display them in a chart?
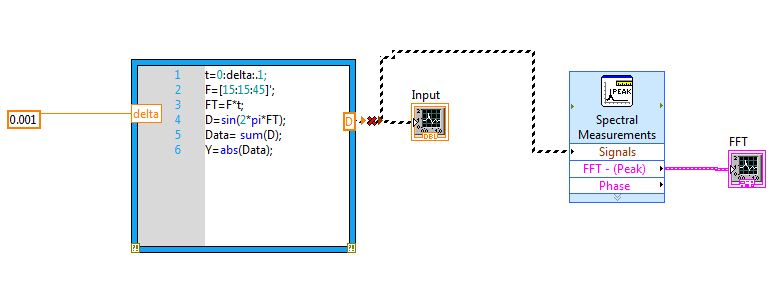
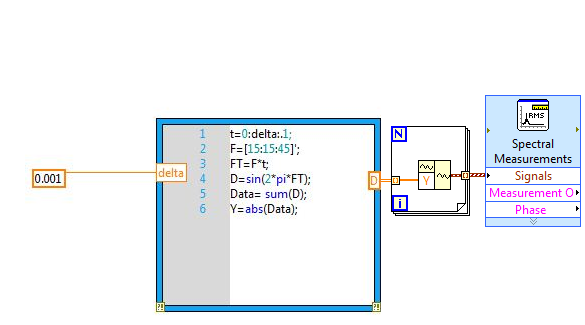
How can I cannect my mathscript output SIgnal of VI entry spectral measures. I have a problem since the release of the mathscript "D" file is 2D DBL. I don't know how to convert such data in order to be logged at the entrance of the signal of the VI of spectral measures. I also want that the waveform graph connected to the output of the VI measures spectral, display the FFT of three sine waves in a chart.
Do not connect. Just go to Forloop.
-
Ideas on how to create a sine wave between 0 and 10 V with NI 5412?
Hello
I tried to create a sine wave from 0 to 10 volts on a 5412 OR. I have 2 problems and I have a question:
(1) I can't generate a waveform with lag, even when using the examples of NEITHER.
(2) the value of the offset, that I can set the camera is of +/-25% range of amplitudes. Do I have to create an arbitrary waveform myself?
(3) in the brochure it says I can get 12 v peak-to-peak. Does this mean that it is between-6 and 6, or it is between 0 and 12?
I would appreciate it if I could see an example.
Thank you very much.
Hi, several notes:
(1) the peak to peak voltage is 12V. For example, it can operate between 0 - 12V.
(2) the shift of 25% limit is for a given wave. That means assuming that it will create a wave, it cannot compensate for 25% of the beach. The solution is to create an arbitrary wave (e.g. a sine between 0 and 10 V) and the function generator to create rather than attempt to compensate for a sine wave.
Thanks for the help though.
-
How to make a sine wave in illustrator?
Hello
I started a thread earlier tonight, but I think I accidentally Pavilion as 'resolved' or something like that (I'm new to this forum). So I'll try this again. I want to know if there is a way to create a sine wave in illustrator. I managed to create a wave of cosine using the on line zig zag effect and choosing "smoothly". But I can't seem to find a good way to do a sinusoidal signal.
That's the difference for those who ask:

I want a sinusoidal signal like the image above.
Thanks for the help!
ekmanch
ekmanch,
If I (put) understand it, to create a single sinusoid full, you can:
(1) create a horizontal line 2.5 times the length of the complete sinusoid desired (or you can adapt the length later);
(2) effect > warp & Transform > Zig Zag 4 grooves by segment and Smmoths Points and height as the size (or you can adapt later);
(3) object > expand appearance.
(4) object > path > add Anchor Points;
(5) with the scissors tool cut where the sine wave starts and ends.
(6) separate if necessary and remove the end bits (and adjust the length/height if necessary).
-
How to generate a square wave of continuous digital output using USB 6343?
I need to generate a square of 600 kHz from my 6343 wave. The specifications indicate I could use PINS P2.0, but I get an error saying that it is not supported.
Thanks in advance for your help.
Jodi
Dan,
Thank you very much. Counter method worked very well.
Jodi
-
How to generate a more accomplished (Professional) table of contents?
In option an option to align numbers must insert a tab after each return as the first version generated does not align them. How to avoid these aditional steps?
(Indesign can control the elements between the number and the order of the day, not more...)

First of all, I don't see numbers to collide with the inscription, even if I have not set a tab stop in the style applied to the TOC entries, and second, the right way to do this IS to set the tab stop where you want. Maybe you put only one stop and it's either too far to the left, or it has been defined as something other than a left-aligned tab. It is user error, not a bug.
What I was describing as a design limitation was the inability to define as aligned page numbers on the right, which was your initial query.
-
For this program, I need to generate a sine wave if a variable is true on the analog output. That's what this part of the program looks like http://i.imgur.com/JrZFOZY.png
Sine wave: http://i.imgur.com/dfYtoL6.png
Data acquisition: http://i.imgur.com/66YLwbH.png
It'll work a little, but then I get this error: http://i.imgur.com/uL1Fm5M.png
Does anyone have a suggestion as to what could be the problem? Specifically, this triggers when TRUE is passed in a second time - it will do very well for the first REAL entry, but then when we become TRUE being re-entered it does not work.
In the acquisition of data, try to change the Mode of generation of finite samples.
-
Hi all
I use a card OR-DAQ 6009, and I'm trying to generate a sine wave of LABVIEW 8.5 and then go out to the analog output of the data acquisition card.
The code I wrote was pretty simple. Generate a sine wave with the help of "create an analog signal" and then connect the sine function «writing» DAQmx. The output of the 'writing' goes into the task of "DAQ Assistant" outside of the loop.
But I get the following error message:
Error-200077 occurred to the property Node DAQmx Timing (arg 1) DAQmx calendar (sample clock)
Property: SampTimingType
You asked: sample clock
You can select: on requestParameters with respect to the timing of the sample in each of the 3 components are:
Creat analog signal: sampling frequency: 10K block size (samples): 100
Writing: Analog, single channel, several samples, waveform
DAQ Assistant: sync settings:
Generationg mode: samples of N
Writing samples: 100
Rate (Hz): 10K
Any help will be appreciated.
Thank you.
Colin
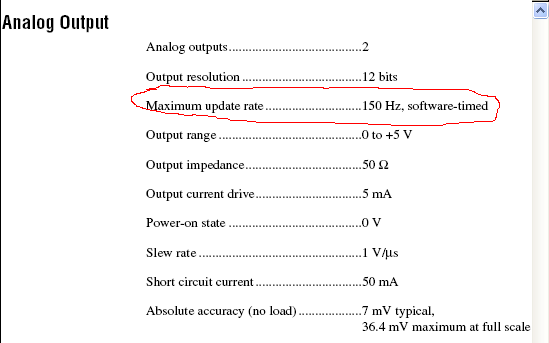
You see this error because the 6009 does not support timed by the material outputs analog. Have you looked at the data sheet of the device? He does not appear. Here it is:
Note that the listed maximum rate is 150 s/s, and it is specified as timed software.
So what you're trying to do is not possible with the 6009. You will need a 6221 or something similar. Make sure that any advice you choose supports analog output clocked by material at a fast enough pace for what you're trying to do.
Edit: I see that Dennis beat me to it!
-
Hi guys,.
Sorry I have a very simple problem. But it seems that I am too new to LabVIEW... and / or have no idea. I've tried a few things but nothing worked propperly.
I need to generate a sine wave with the following of the flexible parameters.
f = 0.02 Hz... 10 Hz
Range = 0... 500
Offset of 1500
I would like to see a cursor moving and get off after the sine wave. The parameters should be changed at any time that the generation of the sine wave inside a While loop. If that would work I intend to integrate that in the code I wrote for an Arduino, Makerhub, slavery... The values already referring...
I tried allmost all the generation of singnal live that I could find but nothing has worked. Calendar completely proven on a waiting insid the while...
Frequencies below 1 Hz is the fast cursor again... WTF...

A sinusoidal 1 Hz signal should make the cursor up and down 1 times per second... or am I totally wrong.
Ah... Perhaps another question. If possible, I want to count the period. For example, after 4 times of the sine wave stop all programs.
Any help apprechiated... I work with LabVIEW 2012SP1
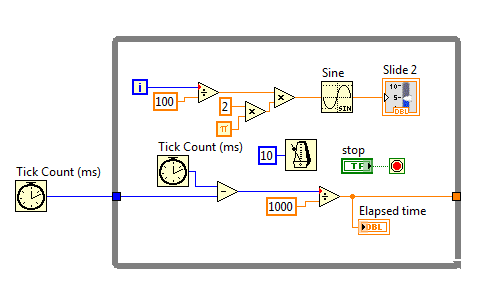
First of all, please understand this waveform generating function works. You specify a waveform (amplitude, frequency, etc.) and whenever you call the function, it returns all the wave specified points.
You can set the number of points with the #s of the info of sampling pole control. As you put the function in a loop, each itaration gives you #s number of points (1000 in your case). You always get a sine wave on your cursor because each iteration returns a different set of 1000 points (this is because of the method, the function calculates the waveform).
The easiest way to create a sine wave is using the sinus (mathematics, primary, Tigonometric, sine) function. You must use the iteration of the I of the loop counter so that the entry of the sine function. Note that the entry is in radians.
With a little math, you can easily produce and display a sinusoid at 1 Hz.
Kind regards
Adam Boros
-
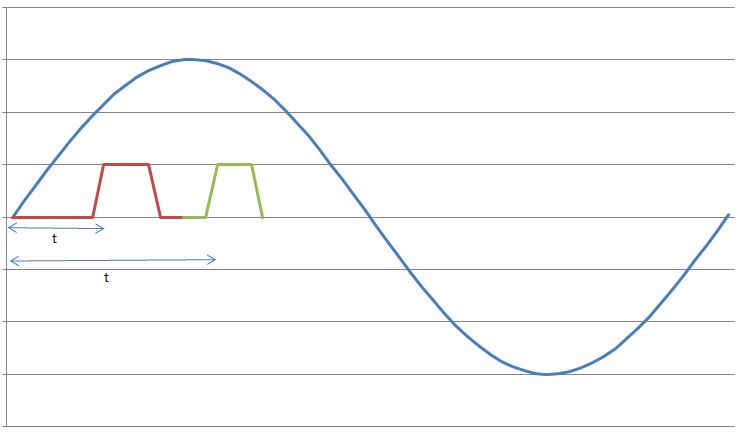
I have a sine wave of 50 Hz and a pulse of the signal on the same chart. The difference in phase between the two is between 0-90 degrees.
Now I need to calculate the time difference between (when the sinusoidal wave passes through zero volts) and (when the pulse increases). The frequency will remain about even for the two signals.
The request is for a three-phase generator. In simple terms, when the difference in time between the passage to zero of the sine wave and pulse increases increases, it means that the load on the generator has increased.
I am a novice user of LabView (version 9, 2009), maybe it's a very simple problem but I was pulling on my hair for the past few days and couldn't understand anything. Any help would be greatly appreciated. I use DAQ USB-6008 to measure these tensions and the impulse of the generator and a sensor
I have attached a jpg file (a graphic that I just did with excel to explain). The time 't' is what I'm trying to measure
See you soon
Zdzislaw
Awais.h,
For problems of this kind I recommend start writing the granular steps you would take to manually fix this problem. You can't say LabVIEW (or any programming language) If you can't succinctly describe the solution to your problem.
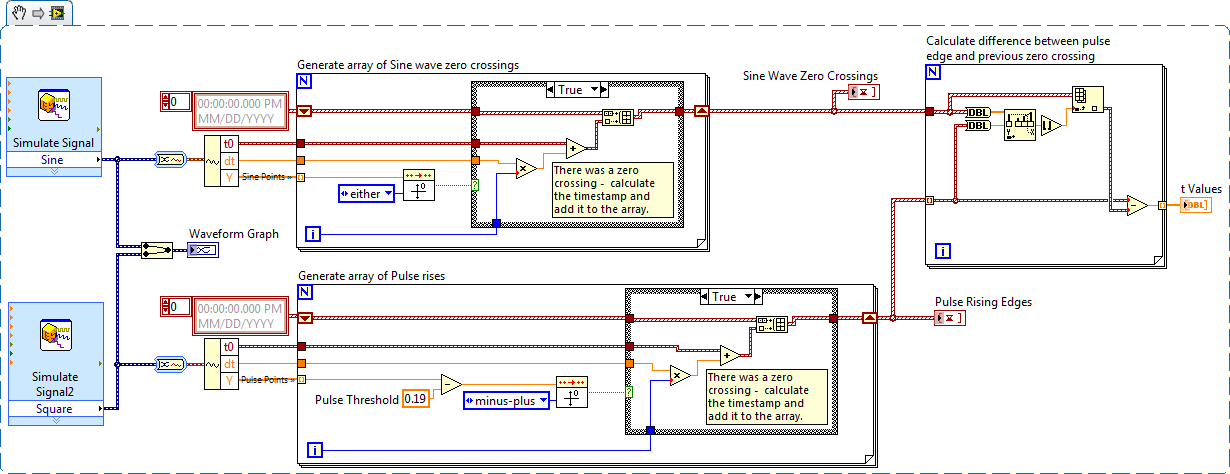
The I want to address this problem is to:
- find all the zero crossing points and edges on the rise
- for every rising edge find the difference between the timestamp and previous passage by zero
Here is an implementation of this algorithm LabVIEW:
-
How to generate the script to insert data tables present in a
How to generate the script to insert data from one table in an entire schema under environment sqlplus
with toads it please help me please!905310 wrote:
How to generate the script to insert data from one table in an entire schema under environment sqlplus
with toads it please help me please!The correct method by using the pump of the database or import/export or unload the data in CSV format for loading using SQL * Loader.
Generate instructions insert with literals is very bad choices - the bind variable is missing. It will be quite slow because many other CPU cycles are spend on hard analysis. The shared pool will become fragmented. This can cause errors of memory for other applications when they attempt to analyze SQLs for cursors.
-
How to take a derivative of a sine wave?
I know this is probably very simple and I'm sure that I'm doing something stupid, but please could someone help me... I'm just trying to draw the derivative of a sine wave on the same graph as the original sine wave. There seems to be working (it shows a cosine wave), but the magnitude is far away. Please could someone just point to me why the amplitude is off... the original sine wave going between 1 and -1, but the derivative is between 60 and -60
Just speculating, but...
- The derivative of a sinusoid of 10 Hz should have an amplitude of ±60 remarks (2 * pi * 10).
- The VI of sinusoidal waveform has a default frequency of 10 Hz.
Coincidence?
Best regards
-
I use Labview 8.5. and the NI USB-6210 device.
I want to display the analog channels over the continuous acquisition.
I can use the table of waveform or waveform graph. Waveform allows you to eat a history buffer. This function is very interresting and useful for my system, but I can't change this value to programming (if I do not mistake!). So, I was wondering if I can also use the waveform graph, but I do not have how to make a circular buffer to replace function "history buffer. I have to use the waveform as a data type.
What is the best solution for my problem? I would like to know if my solution is good (graphic use of waveform) and if anyone has a solution to make an effective circular buffer with the waveform data type?
Thanks in advance, best regards, Daniel
There is an example that comes with LabVIEW called "XY table". It shows you how to create a history for a XY Chart buffer. The size of the history can be changed on the fly. You can adapt the VI "graphic buffer XY ' to work with a data type of waveform." This type of data consists of 3 elements: start on time, delta t and table of values. The only thing that you should be buffering is the array of values.


Maybe you are looking for
-
How to remove "around the web" pop ups?
How to remove 'around the web' pop ups of Safari on my macbook air?
-
Satellite L655D - slow Internet connection
I bought a new laptop because my old Inspiron 1501 has problems. The battery is dead, the R button does not work, the hard drive is 40 GB and the RAM maxed out at 2 GB. A Windows Vista. So anyway my new laptop has 3 GB, more than 200 GB hard disk, Wi
-
Need help my e-mal cases. reset password does not work.
How can I case my email I tried to reset password does not work. I forgot my password and it is entered repeatedly. I want to be to my e-mail or deleate my account. Help, please.
-
Signature of WebWorks code issues
Is anyone else having problems with the signature tool? I ran the tool several times tonight and each time he ends up freezing. I run this from the command line with the signature bbwp option and by Eclipse. Sometimes I get 9 of the 40 signature a
-
BlackBerry Smartphones Facebook, BIS and message of reconciliation
I use the app Facebook 1.6 on my "BOLD". And I like it. But one thing that bothers me... Of course all facebook notification emails have to go to my email account (hotmail). BIS picks them up and then when they hit the unit I guess rather than hittin