PeakDetector on top of waveform DBL
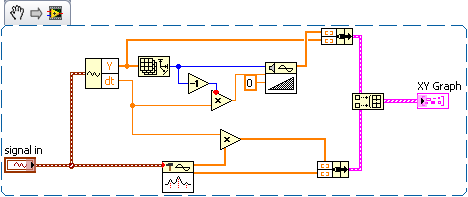
I have a waveform DBL I want to find the vertices. I have the feed in the PeakDetector, but cannot figure out how to place the output of the peakdetector on the same plot in the form of wave DBL. At the end of the day, I want data peakdetector to output to a data file with the same time-domain in the form of wave DBL.
Here is a picture of the current situation.
Thank you!
Hello
You can use the XY graph to plot locations detected PEAK and waveform input.
Please see the code.
Best regards
Michael
Tags: NI Software
Similar Questions
-
Convert the waveform (DBL) to a cluster of 2 elements
Hello
Can someone help me to convert the data type of waveform (DBL) to a cluster of 2 elements (X, Y). I found a few examples online, but I get an error when I wire everything together. I use VI of Tektronix to acquire a signal of channel 2 of my noculars, which I am able to do, but now I want to convert this data to a cluster so that I can use it for an existing application to acquisition. I have attached my VI version 8.2.
1Thanks
The is easy since it is part of the waveform data type. The X, you will need to calculate based on the dt by using a loop FOR.

-
1 table D of waveform DBL file or its
Hello.
I am building an application where I have an accelerometer with an interface USB-1208FS samples.
I have this loop on the inside with a few virtual instruments to display the waveform and frequency of it components. I tried many different approaches to record in a file, but it doesn't seem to work. No file is created even although I am administrator.
Data that are fed to the filters and these great are "table 1 d of waveform (DBL). Tried to convert other types of data, but does not work. This VI for example 'write waveform of File.VI' does nothing even if it should accept this type of data. It's "waveform table is a 1 d table the you want to write to a file of wave forms.»
I'd appreciate any help on my way to accomplish this task. With regard to Abraham
You still have not posted this VI. You say exactly what function and it is inside the loop / out of the loop that wants to say? My only guess is that you use the button stop in the toolbar.
-
Table to convert 1 d of waveform (DBL); Convert the table to a 1 d of waveform (LDM)
Hola a todos soy nuevo in LabVIEW asi os ruego patience, mi duda're basica y annoyingly, como hago para convert a table 1 d in una Forma Onda 'Waveform (DBL)', os editor una imagen y mi VI, Gracias.
Hi all, I am new to using LabVIEW, so I beg you patience, my question is basic and simple, how to convert an array of 1 d in a waveform (DBL), thank you
In my view, that the sound VI gives you a waveform for the right channel and one for the left. For example, you may have to play with the index to determine which channel you want.
-
Conversion of waveform (DBL) in table 1 of double d
HELO
I received samples of I and Q in waveform (LDM). Now I want to convert I and Q in complex form using Re / Im at the complex in the range complex. When I plugged the berries directly to the block, her gives me a connection error that says that
"You have connected two terminals of different types.
The type of the source's Waveform (DBL)
"The sink type is table 1 d of double (real 64 bit ~ 15 digit precision)"
How do I remove it?
I posted the document showing the problem.
Thanks in advance.
Use the appropriate function to extract the table 1 d from the type of waveform data. The data type of waveform consisting of a start time, a dt, and an array of values. To get the array of values that you want to use the function to get the elements of waveform in the waveform palette.
-
How to create a waveform from an array with arbitrary sampling rates
Hi I know that sounds a little silly,
Suppose I created a simple table of figures DBL with a structure For, Say size 16. now, I want to create a waveform DBL with these 16 numbers at an arbitrary sample rate. so if I use 1 kech. / s to the sampling frequency, I want to have a waveform with a duration of 16 milliseconds.
Please help me, I need it too
TNX
Hello
You must use the wave to build function as shown here: http://zone.ni.com/reference/en-XX/help/371361G-01/lvwave/build_waveform/ . Wire you your Board at the entrance Y and then wire the dt of entry in your sampling rate.
-Zach
-
export forms of digital waves + labview
Hi all... I am a newbie with labview and I want help for the beginning... Well, I'm working on a project and to start, I have to use an arbitrary signal and an oscilloscope so that I can see the graph of it (for simplicity I used a sinus at the beginning...) and then I use an A/D converter and the digital output must be saved in a .txt file, so I can read... So I wired the sinuses with the A/D converter, but then I can't make out of it compatible so that I can save it... I used the component 'export waveforms to the worksheet file.vi', but it says error different type of data we can't plug a 'digital waveform"at the entrance to the file"table 1 d of waveform (DBL)? I used, and some other components for recording to a file, but it will be better... What hurts? Please if someone can help me... I would be appreciated!
-
storage of data in real time by program
Hello
I tried to solve this problem for a while now and it seems to be no similar examples out there. I'm trying to store data programmatically, firslty by pressing a switch when I want to start taking data and pressing the same switch when I want to stop and save the file. I created an example VI that demonstrates what I want to do; Generate sine wave function inside a while loop infitnite represents data real time acquisition, the other while the loop opens the file and saves the data until the data switch save is pressed again. The file is closed after the loop at the end of execution.
I did not get this works and if I was hoping if someone could point to me where I went wrong.
Thank you
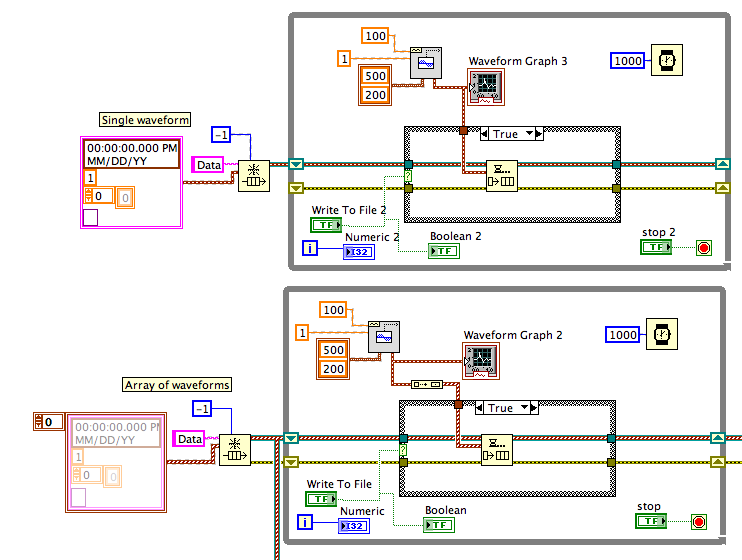
Tip: In programming, always keep the window open context-sensitive help. When you have a problem as the thread cut in the loop of the producer, hover over the wire with the wire tool, and the help context window displays a description of the error. In your case it is said: «Broken wire...» You have connected the two terminals of different types. The type of the source's Waveform (DBL). The type of the sink is a table 1 d of Waveform (DBL)."
The solution is to make two identical data types. If you will use multiple channels for your actual data, a table of waveforms (a wave by channel) can be appropriate. If you use only one channel in your VI test, simply use the data type of waveform. The image below illustrates two methods.
Also, you need not wait (ms) in the loop of the consumer. The Dequeue function will wait until he has given, and then run.
Lynn
-
Why the TDMS file is bigger that we should
Hello
I write data rate simultaneously two analog channels to TDMS file to sample 10 kHz using the capture of data OR PCI card - 6111 12-bit.
Simply calculate:
10000 samples per second x 12 bit x 2 channels is 240000 bits per second = 30 kbytes/s = 1.8 MB per minute.
I have 766 seconds takes long recording, so it should be: 30 kbytes/s x 766 second = about 23 MB.
But my TDMS file takes 123 MB! and I have problem with these large treatment TDMS files, for example I have no memory of enogh for analysis of FOIA. Where is the problem?
Best regards
Kacper
DFGray,
You're right, I wrote the values of voltage in volts as waveform (DBL) of DAQmx, but number DBL is 64-bit, that's why my files was so great.
Now, I write not adjusted data represented as I16 (16-bit integer), and everything is ok.
It is possible to further reduce the size of the file using property DAQmx Channel node - http://zone.ni.com/devzone/cda/tut/p/id/3697#toc1
Kacper
-
How can I make graph waveform or file with two different values of DBL Dynamics excel?
As described in the question, I have two sources dbl from a load cell and linear actuator (from remote). I want to do a curve of load/displacement of the readings of the strength of the load cell and the readings of travel of the linear actuator. Load cell generates an analog signal that can be acquired by data acquisition and the actuator is delivered with a Board and a program of VI to control speed and measure the movement of the actuator at a sampling frequency of my choice. Is it possible that I can do a VI where he continues to collect data and build the chart I'm looking for?
I think I see where the confusion is. Looks like your trip data do not come directly from a sensor (LVDT, etc.), but from the control software. If this is the case, you're stuck sort with a timing of software, that will not sync at all. Still not really sure what the entire Setup is - but if you do not have access to data of travel other than VI control that drives the actuator, you have limited options. It depends on where these data comes from and how it is treated. My initial comment assumed medium of moving a sensor in another Board (Non-OR).
You can absolutely use a shift register data (or the node property history given in the table of waveform - as someone else suggested) to save the data in the file. Use the entry in the File.vi worksheet. There are examples that show how to do this.
I would start by trying to start the process (movement and data acquisition) as close to simultaneously as possible, let them operate independently, but at the same time, then after you have some data you can see if they are synchornized well enough for your application. If you put them both in the same loop with while avoiding (wait ms) you will get incoherently timed data of these two sets of data. Better to use examples of hardware when clock you can. If your test article moves very slowly, it may not matter how you do it. If it does not quickly move, will be discussed as your data of force tip line upward with your data points in moving closer in time.
Good luck!
Kurt
-
Persistence digitizer/oscilloscope waveform
Normal
021
fake
fake
fakePT - BR
X NONE
X NONEMicrosoftInternetExplorer4
/ * Style definitions * /.
table. MsoNormalTable
{mso-style-name: "Table normal";}
MSO-knew-rowband-size: 0;
MSO-knew-colband-size: 0;
MSO-style - noshow:yes;
MSO-style-priority: 99;
MSO-style - qformat:yes;
"mso-style-parent:" ";" "
MSO-padding-alt: 0 cm 0 cm 5.4pt 5.4pt;
MSO-para-margin-top: 0 cm;
MSO-para-margin-right: 0 cm;
MSO-para-margin-bottom: 10.0pt;
MSO-para-margin-left: 0 cm;
line-height: 115%;
MSO-pagination: widow-orphan;
font-size: 11.0pt;
font family: 'Calibri', 'sans-serif ';
MSO-ascii-font-family: Calibri;
MSO-ascii-theme-make: minor-latin;
MSO-hansi-font-family: Calibri;
MSO-hansi-theme-make: minor-latin;
mso-fareast-language: EN-US ;}Is it possible to have the scanners NOR
show waveforms with persistence as benchtop Agilent and Tektronix
Oscilloscopes? I understand ZTec modular oscilloscopes have this function. I have
guess, it can be progemmed using LabVIEW, but is there one out of the way of the plateau of
do?Thank you.
It is currently not a single property or a function that implements persistence for NOR-SCOPE. Your interest for this feature was placed along R & D for future consideration.
You're right that you can set this feature in LabVIEW. I consider using a graph of intensity. The value of x is your time, the value of is the extent of your blood and you browse your waveform, you must create the z values to show the persistence of the wave. Maj reqisters can be used to track the intensity of the previous iteration.
-Jennifer O.
Product Support Engineer - scanners-high speed
-
My goal is to create a graph of waveform with the following criteria.
- Click/double click on the chart to draw the cursor at the nearest location.
- Draw a rectangle to zoom.
- Indicate a way to zoom out.
With the code below, I can double click to draw the cursor to the closest place and draw a rectangle to zoom. However, I can't figure out how to zoom out.
What I am doing wrong?
(Measurement Studio 8.5 & Visual Studio 2008)
Imports NationalInstruments
Imports NationalInstruments.UI
Imports System.DrawingPartial Public Class PlotData
Inherits System.Web.UI.PageProtected Sub Page_Load(ByVal sender As Object, ByVal e As System.EventArgs) Handles Me.Load
If not IsPostBack then ' generate initial random signals
myGraph.PlotY (GenerateData (1000))
End If
End SubProtected Sub myGraph_PlotAreaClick (ByVal sender As Object, ByVal e As NationalInstruments.UI.ClickEventArgs) Handles myGraph.PlotAreaClick
Dim plotX As Double, foot As DoubleInverseMap (myGraph, provable, e.Y, plotX, foot)
myGraph.Cursors (0). MoveCursor (plotX, foot)"To display the click coordinates and plot
cursor_lbl. Text = "X:" & "Y:" & provable, e.Y & "pX:" & plotX & "pY:" & foot
End SubPrivate Shared Function GenerateData(ByVal dataLength As Integer) As Double()
Sun data (dataLength) As Double
Dim rnd As New Random()For i As Integer = 0 To dataLength - 1
Data = Tower. NextDouble() * Math.Sin ((i / 3.15))
NextReturn data
End FunctionPrivate static void InverseMap(ByVal graph As NationalInstruments.UI.WebForms.WaveformGraph, ByVal xClick As Integer, ByVal yClick As Integer, ByRef xPlot As Double, ByRef yPlot As Double)
Dim ACE Double, Double xMin xMax
Dim yMin As Double, yMax As Double
Dim plotLeft As Double, plotRight As Double
Dim plotTop As Double, plotBottom As DoublexMin = graphics. XAxes (0). Range.Minimum
xMax = graphics. XAxes (0). Range.Maximum
yMin = graphics. YAxes (0). Range.Minimum
yMax = graphics. YAxes (0). Range.MaximumWith the chart. PlotAreaBounds
plotLeft =. Left
plotRight =. Right
plotTop =. Back to top
plotBottom =. Bottom
Ends withxPlot = ((xMax-xMin) * ((xClick-plotLeft) / (plotRight - plotLeft))) + xMin
yPlot = ((yMax-yMin) * ((plotBottom-yClick) / (plotBottom - plotTop))) + yMinEnd Sub
End Class
InteractionMode = "ZoomX, ZoomY, PlotAreaClick" >
Hi Steven,
The solution that I can think of is to use a special key (i.e. Control) as well as with a mouse click to zoom out. It will take some work on your part.
The plot are click event does not provide any information on if there is a press of a key. To do this, you manually from the client-side information on the side go server you had pressed the button control key while you click. This can be done using a HTML hidden field.
How to pass the CTRL button information from the client to the server?
(1) adds a hidden field (say with the attributes id and name the value "ControlKeyPressed") inside the form that is rendered by default in the .aspx file.
(2) at the end of the form, write the key down and key events on the document.
(3) in the javascript event handlers, when you press the control key, the value of the hidden field as 'Y', in all other cases, the hidden field value is set to 'n'.
The .aspx code would look like,
onplotareaclick = "WaveformGraph1_PlotAreaClick" >
Now, when there is a PlotAreaClick event triggered on the server (here meaning the c# /VB code), the server manages the parameters that the client had sent. You can access the parameters as follows,
Dim str As String = Context.Request.Params ["ControlKeyPressed"] as string
Now, your PlotAreaClick handler would look like,
protected void WaveformGraph1_PlotAreaClick (object sender, e ClickEventArgs)
{
If (IsPlotAreaClick())
{
//--------------------------------------------------------------------------------------
Important note:
You will need to keep a stack to remember the beaches of x / axes there before setting the new ranges.
Keep the battery in a session variable or a variable application or make the battery a static variable.
First, push the current x / go to the battery.
//--------------------------------------------------------------------------------------Then, complete the tasks that you intend to do.
The new range computed value x / there axes.WaveformGraph1.XAxes [0]. Range = new range (0, 1); It's your new calculated range.
WaveformGraph1.YAxes [0]. Range = new range (0, 1); It's your new calculated range.
}
on the other
{
Pop the stack item and assign the range x / there axes.WaveformGraph1.XAxes [0]. Range = new range (0, 10); Here, you use the skip value of battery.
WaveformGraph1.YAxes [0]. Range = new range (0, 10); Here, you use the skip value of battery.
}
}Private Boolean IsPlotAreaClick()
{
Dim str As String = Context.Request.Params ["ControlKeyPressed"] as stringIf the value of the parameter is 'Y', then it means that the action was a zoom out, not a ground area click.
If (str == 'Y')
Returns false;
otherwise returns true;
}I hope this helps.
-
Hi all
I use NI 9401 as a digital output to control a switch in a simple circuit and using the NI 9205 module for measuring the voltage across a diode in the circuit. The control signal of the swith is a square wave. So what I do is to get two values of the voltage the diode: topic 10us before the falling edge of the waveform and 200us after the falling edge. Then I need to use both voltages to do a little math, let's say, add the two values and trace amount vs time. I am a starter of LabView and have no idea how to do that. Can someone help me?
Hi wademao,
You'll need to do is set up a trigger of reference (descending the wave front) and then read pre and posttrigger samples, something similar to the following illustration:
Then according to the sampling frequency that you use to acquire your analog signal (i.e. voltage at the terminals of the diode) you can exteact predeclenche 10us samples and 200us sample taste samples posttriggered
Can you give us some more details on your hardware configuration? The NI 9205 and NI 9401 in the same cDAQ chassis? What is the model number of your cDAQ? You can generate your relaxation with your NI 9401 (for example on DIO0 - pin 14) and then feed this entry PFI0 sigal (pine 28 or 36 depending on your module) of your NI 9205 module. Once finished with wiring to the top of your material, you can use the examples in the following article to set up your triggered post/pre acquisition:
Tips and Techniques in Acquisition of data triggering - NOR-DAQmx
However, if you are a beginner with LabVIEW I recommend you to read through the following items:
Tutorial of Acquisition of comprehensive data
Learn 10 functions in NOR-DAQmx and handle 80 percent of your Applications of Data Acquisition
-
Another that the convenience of the format of the data acquired, are there benefits (e.g., memory, speed, etc.) usage
DAQmx readout 1 d Wfm NChan NSamp
-Or-
DAQmx read analog 2D DBL NChan NSamp
I'm a life-long in multiple buffer
channels using an architecture of producer/consumer. I am not concerned by information in absolute time available in the format of the wave form; It is convenient, but I can get what I need also. In post processing of the data, the format is a stack or face. If I collect the Wfm 1 d data I end up stripping to the Y-data for certain analyses, but eventually the construction of waveforms for the analysis of the other if I collect a given 2D DBL.-CTF
I did a quick comparative analysis and it seems that the WFM D 1 is slower and takes more memory than the 2D DBL. The overall impact of these differences depends on the size of your data blocks.
-
Updated graphical waveform constantly with digital I/o
I'm new to Labview and I try a digital waveforms graph to update in real time after the analysis of the data of a digital acquisition of data from input to output. Is this possible or real time update can only be done with graphics?
Hello
Once, a very similar subject has been addressed in the forum of LabVIEW, where DFGray has responded to the following:
- You can use an XY graph generating X values yourself. This will ensure that you place the data exactly where you want it on the X axis. It's fast, but involves a cost of memory.
- You can use a chart of waveform with an entry of waveform instead of the cluster that you are using. Use the antiderivative of waveform to build instead of the bundler to make your waveform. Set the values of t0 on the appropriate values (negative work, as do the numbers - time is in seconds, using the primitive of timestamp to convert to DBL timestamp). Finally, you must set the graph of waveform to use the t0 values. Pop - up on the waveform graph and make sure that ignore the time information is not checked. Depending on your version of LabVIEW, you may need to appear on the chart or axis. When you uncheck ignore timestamp, you'll probably want to reformat the x-axis again. Waveform graph clears the data at each iteration, so you have to replot all your data every time. Just create an array of waveforms and keep to add. The t0s will waveforms in the right places. Yes, this can cause memory problems.
- Finally, you can use the waveform, that memory. Create waveforms as you did for the waveform chart and send them to the chart. He remembered what was sent to her from run to run. Make sure to set the length of the graphic history (pop up on the chart and select chart history length...) long enough to contain your data together. You can use a node property to retrieve the data at the end, if you wish.
Link to the original thread: http://forums.ni.com/ni/board/message?board.id=170&requireLogin=False&thread.id=102699
I hope that this solution solves the problem.
Maybe you are looking for
-
is it safe to use a site of grey padlock for purchase with credit card?
I noticed that the lock is sometimes gray on firefox, when green on chrome?
-
How to transfer pod cast from one phone to another iPhone, moved from 5 to 6 and wants to point of transfer of the pod cast on the latest phone.
-
I lost 16 months of emails when I click "Compact Messages" in Outlook Express - Help!
I searched on the internet and made the following to address my problem- . Working offline with Outlook Express . Open Recycle Bin on the Windows desktop . The '.bak' file located I wanted back . Clicked on the file '.bak' with the right button of th
-
Hello I want to run usaf james combat simulation, but when I click on play the game tries to run, but it stops and courses, pleace if you can't help me let me know...
-
Original title: System hangs when you open Add/Remove programs
Original title: System hangs Windows XP crashes each time I have open the control panel and try to view add or remove programs (it also crashes in safe mode). He locks also after has been idle for a few minutes. I tried selective startup mode and the