range lumetri´s scale
In le Scope Lumetri´s, what are the scales When you work with a floating. I recognize the IRE scale et RGB bit depth If I am in 8-bit, but if work floating, two scales and 255 is replaced by value of 0.0 to 1.0 They are v ? Lumetri does not fit with 10 bits?
It s OK and resolved. It s a problem compared with SpeedGrade. You're right, because the first works only with 8 or floating and do not work with 10-bit. the scale are IRE and volts and it was my confusion. Thank you.
Tags: Premiere
Similar Questions
-
Satellite U200 - 1920x1080@64Hz on the external LCD screen resolution problem
I am the owner of a SATELLITE U200 and I would use it with an external LCD display.
The external monitor supports up to 1920x1080@64Hz.
When I select the 1920x1080@64Hz option in the properties of the screen, I get an image enlarged and out of range of the scale. However, by selecting 1400x1050@60Hz seems to work very well.
My question is: is there anyway I can get the 1920x1080@64Hz option working properly?
Some info about my following system:
Version of the OS Microsoft Windows XP Professional 5.1.2600 Service Pack 3
Version of the BIOS Version 3.70
Video Mobile Intel (r) Express Chipset Family worm = 6.14.10.4631 945GM (* even if intel provides versions of this driver newwer, this is the last custom by toshiba *)Intel(r) Graphics Media Accelerator Driver for Mobile report
Report date: 13/03/2009
Report time [hr:mm:ss]: 11:24:18
Driver version: 6.14.10.4631
Operating system: Windows XP * Professional, Service Pack 3 (5.1.2600)
Default language: Spanish
DirectX * Version: 9.0
Physical memory: 1015 MB
Minimum graphics memory: 8 MB
Maximum graphics memory: 128 MB
Used graphics memory: 14Mo
Processor: x 86 family 6 model 8 Stepping 14
Processor speed: 1828 MHZ
Vendor ID: 8086
Device ID: 27A 2
Revision of the device: 03_Accelerator Information_
Accelerator in use: Mobile Intel (r) Express Chipset Family 945GM
Video BIOS: 1358
Graph current mode: 1920 x 1080 True Color (64)Connected to the graphics Accelerator_ _Devices
Active monitors: 1
Active screens: 1_Monitor_
Name of the monitor: Plug-and-Play monitor
Display type: analog
Gamma value: 2.20
DDC2 Protocol: support
Maximum Image size: Horizontal: 20.0 inches
Portrait: 11.0 inches
_Monitor Modes supported: _
640 x 480 (60 Hz)
640 x 480 (67 Hz)
720 x 400 (70 Hz)
800 x 600 (56 Hz)
800 x 600 (60 Hz)
1024 x 768 (60 Hz)
1024 x 768 (70 Hz)
1152 x 864 (75 Hz)
1280 x 1024 (60 Hz)
1280 x 1280 (60 Hz)
1440 x 1440 (60 Hz)
1920 x 1080 (60 Hz)
1920 x 1080 (64)_Display power Management Support: _
Standby mode: not supported
Standby mode: not supported
Active off the coast of the Mode: supported_Notebook_
Name of the monitor: Plug-and-Play monitor
Display type: digital
Gamma value: 3.54
DDC2 Protocol: support_Maximum image Size_
Horizontal: Not available
Vertical: Not available_Monitor Modes supported: _
1280 x 800 (60 Hz)
Display Power Management Support:
Standby mode: supported
Standby mode: supported
Active off the coast of the Mode: not supportedThank you in advance!
It s nice that your monitor supports the screen resolution 1920 x 1080, but you should check your owner's manual.
On page B-4, you will find a list of the supported screen resolution and I must say that the resolution 1920 x 1080 is not taken in charge.
You can select 1920 x 1440 but not 1920 x 1080.Sorry, but the material doesn't supports his screen resolution.
-
Hello world.
I want to read the characters in the document. and I do not select the return on investment. My numbers will be in one line but its position will vary and this number are locked in the border. How can I detect numbers?
Hello ddsdds,
You can certainly detect patterns at the scale of an image. If you use Vision Assistant, I recommend trying the geometric stage corresponding tab of Machine Vision. If you click on the settings tab in the geometrical configuration of Matching, you will see four options for the types of games that will be detected. Check the box next to the option "Chipped" and set a range for the scale you want - 100 being the same size as the image of the model. This would allow you to detect a version to the scale of the image of the model.
In LabVIEW, you can set the scale settings in the geometric model VI IMAQ Setup game using the entrance to 'Beach settings. " You can define a range of scale values to identify matches in the image. You could, of course, simply create a LabVIEW VI from a Vision Assistant script do that instead.
I hope this helps.
-
Restarts output when DAQmxWriteAnalogF64 returns an error
I'm using LabWindows/CVI to output analog voltages on a PXI-6723. My software works well until I try to write a value that is outside the range of the scale of this channel can handle. The call to DAQmxWriteAnalogF64 has legitimate returns error-200561 ("attempt to write the analog data that is too large or too small"). However, following this, when I try to write in the scale of values, DAQmxWriteAnalogF64 returns-200293 ("generation has not yet begun, and not enough space is available in the buffer. Set a larger buffer, or start the generation before writing data more than content in the buffer"). What is the cause of this?
Thank you
Martin
When occurs the first mistake the task stops and does not restart until everything is better. If you call DAQmx writing with Autostart T you need stop and start the task specifically after this error to clear the "incorrect value".
-
Hello
I have problems with my pid in the sense that it displays only 2 values(min_and_max).i have tried different gains and yet it will not work properly.can someone help me please? the process I'm tring to control is an oven, and I use NEITHER 6024E and CSC-2345. (I also tried without the dt s, using a simple wait in the while loop, but it is not influence it)
Your output range is tiny (0 to 0.02). In the meantime your comments seems to be on a much larger scale. Your P gain being 20, any error (difference between setpoint and variable processes) greater than 0.001 will be enough to drive the full output or full out (20 * 0.001 = 0.02). You need either a larger output range (and then scale before you send the output to the DAQ hardware) or much smaller gains (which could result in the loss of some mathematical precision).
-
How to move several scrollbars field with a scroll bar
Hello
Does anyone know if there is a property node available where I can use the axis scroll bar x on a plot to control several bars scroll to the category axis at the same time? I have three plots and I want all scroll to the time where I drag the scroll bar on one... I've been going through the nodes of property but fails to do so.
Thank you very much!
I think that the only way to do this is to monitor the range of the scale X, as the beginning of the beach. If the user clicks the scroll bar, changes in range if you can it detect this way. You can then set the scale on the other graphics to match.
-
Make brilliant darker but maintaining
Hello
I'm trying to take the attached picture of red lipstick and make the upper part (the lipstick) real color of a second attachment.
However, when I get the color near him using Chromakey, hue and Saturation and brightness contrast, I end up losing that nice shiny effect which is on it now.
Is it possible to make it look like that color while keeping the shine?
Thank you!


- Switch to LAB color (Image > Mode > LAB color)
- Place the color you want in a new layer.
- Select lipstick by using your favorite method (Pen tool, quick selection, etc.)
- Create a layer mask on the layer from the selection color
- Switch of blending mode of the layer of color to color
- Add a new curves adjustment layer, delete a layer mask, then hold down Alt (or Opt) and drag the layer mask to the layer of color on the curves layer (will be fooled for the curves layer).
- With the lightness channel selected in the curves adjustment, adjust the curve until the desired weight is reached.
- Flatten the Image and return to RGB color

A better way would be to use the Reds in hue/Sat, and the range of the scale until all lipsticks is affected, then by adjusting the saturation and hue sliders until the desired color is reached. Then use curves to correct the lightness.

-
Progress bar joined two or two range of scale of diferent in a Progress bar!
Hello guys,.
I try to get 2 diferent scales range in a progress bar. But I can't get it.
So, I tried to join 2 progess bar putting made it adapts to look like as I want. One of 0 to 100 and the second from 100 to 300.
In case I have to use 2 progress bar, the problem is the second start with the mark on the start menu, I would second to be completely clear of 0.
Is this possible?.
Kind regards.
Alternatively, you can set the Fill Style. 0 is no fill, while 1 is fill to Min.
-
Scattergraph crash when refreshing scale the y-axis beyond a certain range programmatically
I have a subscription issue that I'm glued involving control scattergraph. I put my scattergraph to a fixed scale of 0-25 in the loading screen. When the graph is updated I check to see if the value of y is greater than the scale of the axis y. If and when it does update the scale fixed to range from 0 the previous litter, 25. So if it exceeded range 0-25, he was jumping at 0-50, if it exceeded 0-50, he was jumping to 0-75. The issue I'm having is well after the range 0-75 when he tries to change the scale of 0 to 100, the graph crashes and turns into a red x. I have no idea why it is doing at this point, so any help is appreciated. Here is my code to update the graph:
yAxisMax = YAxis1.Range.Maximum

        If val1 > yAxisMax or val2 > yAxisMax then

            ScatterGraph1.YAxes (0). Range = New NationalInstruments.UI.Range(0, yAxisMax + 25)

            ScatterGraph1.YAxes (0). MajorDivisions.Interval += 5

            ScatterGraph1.Refresh)

        End If
Don't know if it's important but I'm updating simultaneously two clouds of points.
Hello
I made a simple app with a scattergraph and a button on a form. It works very well. There must be something wrong with your values of Y.
Public Class Form1
As Double Dim yVal
Private Sub Button1_Click(ByVal sender As System.Object, ByVal e As System.EventArgs) Handles Button1.Click
Dim nowValue As Date
Dim convertedValue As Double = 0Try
nowValue = Now()convertedValue = CDbl (DataConverter.Convert (nowValue, GetType (Double)))
yVal = yVal + 5ScatterPlot1.PlotXYAppend (convertedValue, Convert.ToDouble (yVal))
Catch ex As Exception
End Try
End Sub
Private Sub Form1_Load(ByVal sender As System.Object, ByVal e As System.EventArgs) Handles MyBase.Load
TryMe.XAxis1.MajorDivisions.LabelFormat = New NationalInstruments.UI.FormatString (NationalInstruments.UI.FormatStringMode.DateTime, "h:mm:ss tt")
Catch ex As Exception
End Try
End Sub
End ClassCurt
-
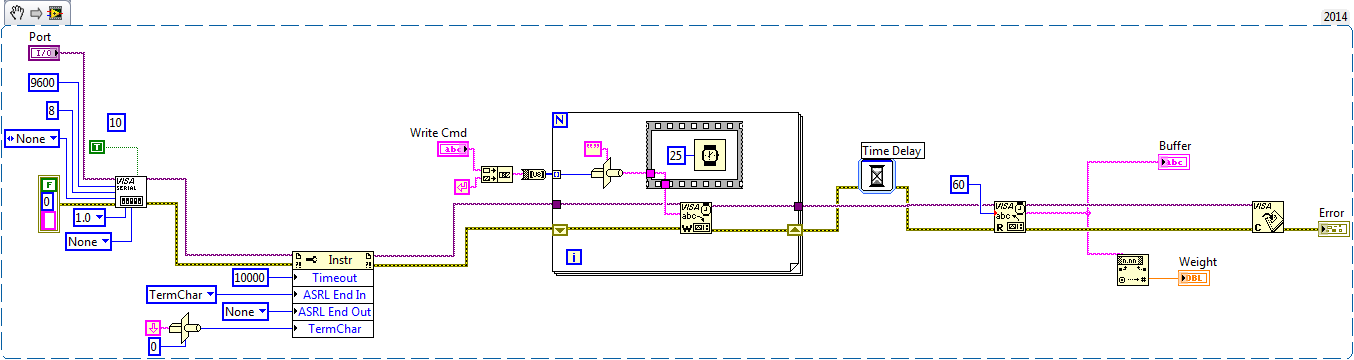
Cannot read serial communication in OHAUS Ranger 7000
Hello
I'm reading a balance OHAUS Ranger 7000 data. Communication is via a virtual USB port (drivers came with scale). I have configured the port according to the parameters of their manual series. But for some reason I'm not able to read all the data. The process is either expire or I read 0 bytes data. I have attached the snippet here. I'd appreciate really any suggestions on this.
Thank you
Naren
I have tried several things and understood the mistake. The program worked when I wrote the one byte of orders at a time.
-
How to prevent from being changed by the user or: SliderDouble ranges
Hello
I have a slider in WPF / c#
<>
 liderDouble height = "60" Name = 'updateRate"ValueChanged ="OnUpdateRateValueChanged"range ="0.05,1"Value ="0.05"/ >
When the application runs in user can change min or max value of the range by clicking on the lable of ticks and changing the value.
Need a way to prevent/protect, make unmodifiable.
Thank you
Yuri
Range scale of editing is controlled by the
InteractionModeproperty to the cursor. To turn off theEditRange, you can assign a different set of indicator values, such asInteractionMode="ArrowKeys,Drag,Snap,ScrollWheel". -
Apply the custom scale and add Boolean if I can connect on demand
Hello
I have a problem adding my custom code scale. I have a pressure sensor that works in the range of 4-20mA. So, I made a custom scale as you can see in the code and tried to connect the name of custom on the DAQ.mx scale. Which doesn't seem to work any suggestions?
Another problem I have is I want to be able to log on to the application with a Boolean button. How to do that if I want to keep the ability to write data only to a determined time interval?
Greetings
DP
-
vertical scale 5152, set up the time
I use a pxi-5152 in a pxi-1033 chassis.
I want to play a trick and change the vertical scale between my measurements to increase the dynamic range of a signal that I'm scanning. I made a loop and changed the vertical scale property node after each measurement. It works, but when I timed it the loop, she seems to take 80 ms. I need to do in less than 10 milliseconds.
Is it still possible? I see the real time it takes for the scale change or there at - it something to speed up?
I also have access to a PXI real-time with the same card. Could only accelerate things or is the digitized the limiting on the change of scale factor?
Thanks for any help
-Rich
Hi rich,
I see the real time it takes for the scale change or there at - it something to speed up?
You probably see the effect of the two. There may be something of software that you can do to improve it, but there's always a material limitation when you do this kind of operation. Switching of the means of vertical lines change from one type of mitigation to another path. This means there is sedimentation time involved (electronic and mechanical, with obviously dominant mechanics). The main element in the run-in will probably be the relays that are reversed. There must be a minimum period after the passage of a relay to ensure the data read by the digitizer are correct / valid.
Since you know your signal is going in a direction (descending), then you may be able to improve somewhat by calling the property to write the new range, and then commit node & initiating in a loop which contains a minimum transformation (possibly using queues in LabVIEW to transfer the data in another loop of treatment). If you need treatment in the loop, you must perform the treatment after niScope commit but before launch niScope. This will allow the digitizer begin to settle in the new configuration, and you have to wait less time when you're ready to call to initiate.
I also have access to a PXI real-time with the same card. Could only accelerate things or is the digitized the limiting on the change of scale factor?
Real-time processing ensures determinism, it does not necessarily speed up the application. Determinism and defining a specific priority for calculations of software can help speed upward the software that you are running, the interface of low-level PCI/PXI bus driver with the instrument probably will not change radically. You can certainly try though and let us know what you measure.
I can understand if it is a fundamental issue, because normally people are not change the range of vertical entry on the fly, but if there is a way around it, it will avoid the need for me to put an amplifier with variable gain on the front-end server or buy a digitizer with more bits.
This isn't a perfect suggestion, but just a thought: If you have several scanners at your disposal, you might try setting each to a fixed vertical range and split the signal among them. TClk, you can synchronize these devices together to make sure your data points are sampled at the same time, and then introduce delays in the initial on each digitizer trigger so that they take account of the waveform in a cascade mode. For example,.
Digitizer #1, attached to the greater vertical reach, would have no time limit from the time wherever the trigger is received.
#2 digitizer, set at a smaller vertical range has a fixed period of (10ms?)
Digitizer #3, value the smaller Beach, has a fixed time (20ms?).
Otherwise, if you have assistance with the OR, you could try to call a technical sales engineer to discuss other possible options.
-Andrew
-
questions of small scale log values
I have a strange problems with tracing values in graphs for NI Measurement studio WPF. This problem occurs when the axis is log based on and the value on the axis spans less than 1 to 1 (i.e. 0.001 to 1000). The chart automatically change the lower x-axis to limit to 1. The behavior is similar to the one reported here (http://forums.ni.com/t5/Measurement-Studio-for-NET/log-scale-won-t-scale-to-show-small-values/m-p/27...) but in my case, none of the mapped value is 0 or less than the lower limit of 0 and the axis is set to greater than 0.
The code below will reproduce the problem:
Focus() pt = new Point [100];
for (int i = 1; i)<=>
{
PT [i-1] = new Point (0,1 * I, me)
}Field pl = new Plot ("test");
PL. data = pt;
Graph Plots.Add (pl);
Where the x-axis of the graph are log10 scale (and the boundaries are defined on {0,1, 10} in the code .xaml) and the y axis is linear (no matter the scale really). The chart automatically x-axis it 1 and this can be changed to 0.1 but it comes back again to 1 if the visible property of the chart changed.
This behavious doesn't happen if all the x-axis values are less than 1 or greater than 1 that is the code below to draw correctly and the axis is not reset to 1, etc.:
Focus() pt = new Point [100];
for (int i = 1; i)<=>
{
PT [i-1] = new Point (0.001 * I, me)
}Field pl = new Plot ("test");
PL. data = pt;
Graph Plots.Add (pl);
Someone knows it why it behaves like that and what can we do to fix this?
Which seems to be the case, it's that the default
FitLooselyrange adjustment see values ranging from 10-1 to 10-1, and then choose a range of0,10for data. Since no one can be represented on a logarithmic scale, forced the scale to an arbitrary value, less than ten years, thus giving a final range of1,10and truncating low values. I created a task to solve this problem.To work around the problem, you can change the
Adjusteron the scale to another value, such asFitExactly. -
The scrapping of values above ranges
Hello world!
I need help. What I'm trying to do is take a picture of 51 items and draw his PSD and application of statistics.
But before that I want to scan that is the elements of the array are in my set of ranges. So if the amplitudes of these 51 all the values are less upper-8 and 8 and then pass it to the power spectrum. But if this isn't the case then go back and take the new table of 51 items.
Now the question is how can we ignore this table (whose elements are not in the range) and replace it with a new one (coming to boost signal). Because I don't want to see NaN in ArrayM but the values in my defined ranges permanently.
I hope that I have given my point clearly.
Here's my messy code, sorry for that.

Thank you
Concerning
AG
Hello Jumper,
The easiest way to do this with your current code is to place your analysis in the real case of the structure of your business - this only to process the data and update your user interface if the 'acquisition' is within reach. Be aware that this won't scale well - I recommend a state machine architecture that repeated an acquisition until your conditions are met and then proceeds to the processing of the data.
In addition, you can consider using the function in the range and Coerce rather than max/min etc. Using output "in the range?" makes clear to any future developer exactly what you're trying to do.
Nice work on the documentation-VI, by the way and thank you for the VI is in a usable state without modification before posting! It is incredibly useful.
Best regards


Maybe you are looking for
-
Satellite Pro A120: Which adapter should I use
I have a Satellite Pro A120 and urgent enough I need a new power supply. Can I go to PC World and buy any universal laptop charger, or do I have to buy something special? Thank you Sophie
-
Windows XP download with proof of purchase from microsoft
My original home edition of Windows Xp disk was stolen with my car and now I need to stop this problem of error i386 on my desk. I still have 25 digit key code. So is it possible of doen loaded from microsoft?
-
CP1525NW COLOR: PRINTER POWER SUPPLY MANUAL
My printer is on manual feed when I make a number of copies I have to hold the button I can't get off it advance manual any suggestions?
-
Do not get kitkat update for place 7
Bought a place 7. When I connected to the internet, sign up with google, Dell and all, I don't get always updated Kitkat. Am I missing measures? Or it will take time (perhaps days) to get it?
-
How to install my bb on playbook application
y at - it a Web page that tell me how to install my existing application to bb for the playbook, I want to see what it looks like. I have the operational playbook Simulator Maybe there is a conversion that must be held from jad to xyz? is it possible