Simply select the values between min and max of a value accumulated during the day
Hello Forum,a value is accumulated more a day and over a period of time. The next day, the value is reset and starts to build up again:
with sampledata as (select to_date('09.09.2012 00:04:08', 'dd.mm.yyyy hh24:mi:ss') ts, 120 val from dual union all
                   select to_date('09.09.2012 01:03:08', 'dd.mm.yyyy hh24:mi:ss') ts, 120 val from dual union all
                   select to_date('09.09.2012 02:54:11', 'dd.mm.yyyy hh24:mi:ss') ts, 120 val from dual union all
                   select to_date('09.09.2012 03:04:08', 'dd.mm.yyyy hh24:mi:ss') ts, 120 val from dual union all
                   select to_date('09.09.2012 04:04:19', 'dd.mm.yyyy hh24:mi:ss') ts, 120 val from dual union all
                   select to_date('09.09.2012 05:04:20', 'dd.mm.yyyy hh24:mi:ss') ts, 120 val from dual union all
                   select to_date('09.09.2012 06:12:02', 'dd.mm.yyyy hh24:mi:ss') ts, 23 val from dual union all
                   select to_date('09.09.2012 07:12:03', 'dd.mm.yyyy hh24:mi:ss') ts, 29 val from dual union all
                   select to_date('09.09.2012 08:12:04', 'dd.mm.yyyy hh24:mi:ss') ts, 30 val from dual union all
                   select to_date('09.09.2012 09:12:11', 'dd.mm.yyyy hh24:mi:ss') ts, 45 val from dual union all
                   select to_date('09.09.2012 10:12:12', 'dd.mm.yyyy hh24:mi:ss') ts, 60 val from dual union all
                   select to_date('09.09.2012 11:12:13', 'dd.mm.yyyy hh24:mi:ss') ts, 75 val from dual union all
                   select to_date('09.09.2012 12:21:24', 'dd.mm.yyyy hh24:mi:ss') ts, 95 val from dual union all
                   select to_date('09.09.2012 13:21:26', 'dd.mm.yyyy hh24:mi:ss') ts, 120 val from dual union all
                   select to_date('09.09.2012 14:21:27', 'dd.mm.yyyy hh24:mi:ss') ts, 142 val from dual union all
                   select to_date('09.09.2012 15:21:30', 'dd.mm.yyyy hh24:mi:ss') ts, 142 val from dual union all
                   select to_date('09.09.2012 16:21:32', 'dd.mm.yyyy hh24:mi:ss') ts, 142 val from dual union all
                   select to_date('09.09.2012 17:21:33', 'dd.mm.yyyy hh24:mi:ss') ts, 142 val from dual union all
                   select to_date('09.09.2012 21:21:33', 'dd.mm.yyyy hh24:mi:ss') ts, 142 val from dual union all
                   select to_date('09.09.2012 23:21:33', 'dd.mm.yyyy hh24:mi:ss') ts, 142 val from dual union all
                   select to_date('10.09.2012 00:04:08', 'dd.mm.yyyy hh24:mi:ss') ts, 142 val from dual union all
                   select to_date('10.09.2012 01:03:08', 'dd.mm.yyyy hh24:mi:ss') ts, 142 val from dual union all
                   select to_date('10.09.2012 02:54:11', 'dd.mm.yyyy hh24:mi:ss') ts, 142 val from dual union all
                   select to_date('10.09.2012 03:04:08', 'dd.mm.yyyy hh24:mi:ss') ts, 142 val from dual union all
                   select to_date('10.09.2012 04:04:19', 'dd.mm.yyyy hh24:mi:ss') ts, 142 val from dual union all
                   select to_date('10.09.2012 05:04:20', 'dd.mm.yyyy hh24:mi:ss') ts, 142 val from dual union all
                   select to_date('10.09.2012 06:12:02', 'dd.mm.yyyy hh24:mi:ss') ts, 14 val from dual union all
                   select to_date('10.09.2012 07:12:03', 'dd.mm.yyyy hh24:mi:ss') ts, 34 val from dual union all
                   select to_date('10.09.2012 08:12:04', 'dd.mm.yyyy hh24:mi:ss') ts, 58 val from dual union all
                   select to_date('10.09.2012 09:12:11', 'dd.mm.yyyy hh24:mi:ss') ts, 70 val from dual union all
                   select to_date('10.09.2012 10:12:12', 'dd.mm.yyyy hh24:mi:ss') ts, 120 val from dual union all
                   select to_date('10.09.2012 11:12:13', 'dd.mm.yyyy hh24:mi:ss') ts, 142 val from dual union all
                   select to_date('10.09.2012 12:21:24', 'dd.mm.yyyy hh24:mi:ss') ts, 153 val from dual union all
                   select to_date('10.09.2012 13:21:26', 'dd.mm.yyyy hh24:mi:ss') ts, 153 val from dual union all
                   select to_date('10.09.2012 14:21:27', 'dd.mm.yyyy hh24:mi:ss') ts, 153 val from dual union all
                   select to_date('10.09.2012 15:21:30', 'dd.mm.yyyy hh24:mi:ss') ts, 153 val from dual union all
                   select to_date('10.09.2012 16:21:32', 'dd.mm.yyyy hh24:mi:ss') ts, 153 val from dual union all
                   select to_date('10.09.2012 21:21:33', 'dd.mm.yyyy hh24:mi:ss') ts, 153 val from dual)
select   ts, val
from     sampledata
order by ts asc;TS VAL
09.09.12 06:12 23
09.09.12 07:12 29
09.09.12 08:12 30
09.09.12 09:12 45
09.09.12 10:12 60
09.09.12 11:12 75
09.09.12 12:21 95
09.09.12 13:21 120
09.09.12 14:21 142
10.09.12 06:12 14
10.09.12 07:12 34
10.09.12 08:12 58
10.09.12 09:12 70
10.09.12 10:12 120
10.09.12 11:12 142
10.09.12 12:21 153Hello
msinn wrote:
Hello Forum,a value is accumulated more a day and over a period of time. The next day, the value is reset and starts to build up again:
Thanks for posting the sample data and results. Be sure to explain how you get these results from these data. For example "for each day, I just want to show the lines after the daily low was reached. For example, on September 9, the lowest val was 23, which occurred at 6:12, so I don't want to show all lines earier to 06:12 September 9. In addition, when a val is the same as or more than the previous same day val (in order by ts), then I don't want to display the line later. For example, on 9 September, there are several consecutive lines, starting at 14:21 which all have the same val, 142. I want to only display the ealiest of this group, the line of 14:21. »
Here's a way to do it, using analytical functions:
WITH   got_analytics     AS
(
     SELECT  ts, val
     ,     MIN  (val) OVER ( PARTITION BY  TRUNC (ts)
                              ORDER BY       ts  DESC
                    )      AS min_val_after
     ,     CASE
              WHEN  val = MIN (val) OVER (PARTITION BY  TRUNC (ts))
              THEN  -1    -- Impossibly low val.  See note below
              ELSE  LAG  (val) OVER ( PARTITION BY  TRUNC (ts)
                                          ORDER BY         ts
                           )
          END      AS prev_val
     FROM    sampledata
)
SELECT       ts
,       val
FROM       got_analytics
WHERE       val     <= min_val_after
AND       val     >  prev_val
ORDER BY  ts
;
This requires that val > = 0. If you don't know a lower bound for val, and then the same basic approach still works, but it's a bit messier.
Tags: Database
Similar Questions
-
Help the query to list all the days between MIN and MAX date in a table
Hello
Sorry, this may have already responded earlier, but I really struggled to find a previous response with the new provision of the RTO.
In a DB 11 g, I date MIN and MAX in a table:
{code}
SELECT MIN (process_date) start_date, MAX (process_date) end_date FROM my_table;
{code}
I would get every day between these 2 dates. I mean even is there is no record in the table for a date.
Is this possible?
Thanks in advance,
Olivier
Hello
Do you mean something like this?
ranit@XE11GR2>> ed Wrote file c:\rb\1.sql 1 with xx as 2 ( 3 select 4 to_date('05-06-2013','dd-mm-yyyy') min_d, 5 to_date('20-06-2013','dd-mm-yyyy') max_d 6 from dual 7 ) 8 -- 9 -- end of test data 10 -- 11 select 12 min_d + level date_x 13 from xx 14* connect by level<=(max_d-min_d) ranit@XE11GR2>> / DATE_X ------------------- 06-06-2013 00:00:00 07-06-2013 00:00:00 08-06-2013 00:00:00 09-06-2013 00:00:00 10-06-2013 00:00:00 11-06-2013 00:00:00 12-06-2013 00:00:00 13-06-2013 00:00:00 14-06-2013 00:00:00 15-06-2013 00:00:00 16-06-2013 00:00:00 17-06-2013 00:00:00 18-06-2013 00:00:00 19-06-2013 00:00:00 20-06-2013 00:00:00 15 rows selected. -
PanelBox including stretch between min and max height
Hello
I use JDeveloper 11.1.1.6 and my customer requests in the application I am developing a PanelBox stretching from its height according to the content inside. There is a minimum height (which may be greater than the height the content) and a maximum height (which, if the content exceeded, should display a scroll bar).
If you have any suggestions on how I could reach it (including editing the CSS file) please let me know.
Best regards
Toma
Hi Frank,.
I did this and, in combination with certain CSS styles, I managed to do things. The part that essentially does the work is the property of 'type' equal 'sink '. Styling covered the min-height and max-height, as well as other small visual changes.
Thank you very much!
-
the min and MAX values maintain their good values tia sal22
the min and MAX values maintain their good values tia sal22
Hi all
I have problems a little value to stay in their correct min and max values min and max.
Continue to change their values (up and down) trying to get the max value to only display the maximum value at a given time and the same for the min value. I looked at the examples max and min and it seems that it should be in a while loop
http://forums.NI.com/NI/board/message?board.ID=170&thread.ID=359822but I would add another while loop and if so put it in the loop for? or is there a better way to do it.
TIA sal22
Hi sal22,
I thought it was just one example you found somewhere, because it is called red rooster. See the attached example.
Mike
-
Grouping and then find the min and max
DROP TABLE purge of y;
CREATE TABLE y
(
ID NUMBER (10),
START_DATE_TIME NUMBER (15),
END_DATE_TIME NUMBER (15)
);INSERT INTO y VALUES (1, 20140602164819, 20140606140851);
INSERT INTO y VALUES (1, 20140827141743, 20140827142131);
INSERT INTO y VALUES (1, 20140827141744, 20140827141835);
INSERT INTO y VALUES (1, 20140827141744, 20140827142131);
INSERT INTO y VALUES (1, 20140827141944, 20140827142131);
INSERT INTO y VALUES (1, 20140827141944, 20140924142131);
INSERT INTO y VALUES (1, 20140927141944, 20141027142131);
INSERT INTO y VALUES (2, 20140602164819, 20140606140851);
INSERT INTO y VALUES (2, 20140827141743, 20140827142131);
INSERT INTO y VALUES (2, 20140827141744, 20140827141835);
INSERT INTO y VALUES (2, 20140827141744, 20140827142131);
INSERT INTO y VALUES (2, 20140827141944, 20140827142131);
INSERT INTO y VALUES (2, 20140827141944, 20140924142131);
INSERT INTO y VALUES (2, 20140927141944, 20141027142131);COMMIT;
Select
*
Of
There
order by 2, 3;out necessary: when the output of the table are sorted by start_date_time and end_date_time in ascending order.
and when the value of for a particular id start_date_time is located between the
another set of values start_date_time and end_date_time for the same id then min (start_date_time) and max (end_date_time) is the desired output.and if there is no overlap then (start_date_time) min and max (end_date_time) is the output desired.
and for each line of the output in ascending order of line number order addd;
Example output is in the output table named
drop table output is serving;
create an output table
(
ID NUMBER (10),
START_DATE_TIME NUMBER (15),
END_DATE_TIME NUMBER (15),
ROW_NUMBER NUMBER (10)
);
Values to INSERT OUTPUT (1, 20140602164819, 20140606140851, 1);
Values to INSERT OUTPUT (1, 20140827141743, 20140924142131, 2);
Values to INSERT OUTPUT (1, 20140927141944, 20141027142131, 3);
Values to INSERT OUTPUT (2, 20140602164819, 20140606140851, 1);
Values to INSERT OUTPUT (2, 20140827141743, 20140924142131, 2);
Values to INSERT OUTPUT (2, 20140927141944, 20141027142131, 3);COMMIT;
SELECT
*
Of
output
ORDER BY 1,2,3,4;Thank you
SQL_Novice
Hello
Your postal code. It is difficult to tell what you're doing wrong without knowing what you are doing.
user6166680 wrote:
Hi Frank:
Max works for ID 3 values only because there is only one group here, as all other values compared, they overlap with max (end_date_time);
but when I use MAX for ID 1 and 2, the result set is not the same thing as LAG works because there is a GAP...
Exactly, you have to find the gaps. If start_date_time is less than or equal to the MAXIMUM of all the end_date_times earlier, then it isn't a gap; Otherwise, there is a gap.
What is the problem with MAX?
WITH got_new_group AS
(
SELECT id, start_date_time and end_date_time
CASE
WHEN start_date_time <= > MAX (end_date_time) OVER (PARTITION BY id )
ORDER BY start_date_time
end_date_time
ROWS BETWEEN UNBOUNDED PRECEDING
AND 1 PRECEDING
)
THEN 0
1. OTHER
END AS new_group
OF y
)
got_group_number AS
(
SELECT id, start_date_time and end_date_time
SUM (new_group) OVER (PARTITION BY ID.
ORDER BY start_date_time
end_date_time
) AS group_number
OF got_new_group
)
SELECT id
MIN (start_date_time) AS group_start_date_time
MAX (end_date_time) AS group_end_date_time
group_number
OF got_group_number
GROUP BY id, group_number
ORDER BY id, group_number
;
You will notice that it is exactly what I posted earlier, in response #5, except that instead of using the OFFSET it uses MAX.
Output:
ID GROUP_START_DATE_TIME GROUP_END_DATE_TIME GROUP_NUMBER
--------------- --------------------- ------------------- ---------------
1 20140602164819 20140606140851 1
1 20140827141743 20140924142131 2
1 20140927141944 20141027142131 3
2 20140602164819 20140606140851 1
2 20140827141743 20140924142131 2
2 20140927141944 20141027142131 3
3 20140330041350 47121231000000 1
-
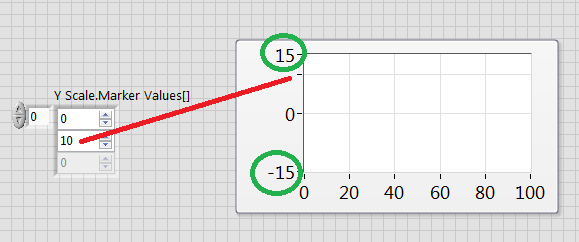
Delete the min and max labels on chart axis markers
Hello
Is it possible to remove the min and max labels on chart axis markers? For example, see the screenshot below. Can I remove the numbers circled in green without changing the range of the axis? In some cases (like this one), the presence of the min and max number of cases other marker values to not be displayed (red line). I am aware that "10" is displayed if I enlarge the graph, but this isn't an option for my application. FYI - the screenshot is from the side before the attached VI.
Thanks for any help,
Kind regards
Stu
You can't delete them because they are the main features to be able to set the max and min on the graph of the Panel before if you use no-AutoScaling.
-
Taskbar and min and max do not show on the homepage and e-mail
When cleaning key board, the taskbar, and the top part of the page containing the min and max symbols disapperared. How can I restore them?
Hello
I suggest you to try the steps below and check if it helps.
(a) open Internet Explorer by pressing the button of the window of your keyboard, then clicking on Internet Explorer.
(b) move your cursor to the top right and click the Tools button, and then click file.
(c) uncheck the option full screen .
You can also press F11 on your keyboard, which would help you to get to the normal screen.
Hope this information is useful.
-
Hello. I want to make a program where I want to generate a sine and take only the monotonous positive part.
So I thought to find the min and max of the function index and make a program like the one attached.
As you can see that if you set the frequency to 10 Hz, it works fine... the problem is when you change the frequency such as 20 or 50 H.. t seems that it is not find the min and max correctly.
Can you suggest me some tips?
Thank you
s.turino84 wrote:
and take only positive part monotonous.
This means that the derivative is positive. So, make a derivative. If the derivative is greater than 0 keep the present value, or the value 0.

-
Hi guys,.
Do you know how I can get the MIN and MAX in a row?
For example:
C1 | C2 | C3 | C4 | C5 | C6 | C7 | C8
10. 50. 70. 5. 90. 135. 4 | 60
I return 4 and 135.
I can return it without using the service?
Thank you
Eric
create table t as
with d as (
  select 1 n from dual
  union all
  select null from dual
)
select a.n c1, b.n*2 c2, c.n*3 c3
from d a, d b, d c;

select c1,c2,c3,
greatest(
  coalesce(c1,c2,c3),
  coalesce(c2,c3,c1),
  coalesce(c3,c1,c2)
) greatest_c,
least(
  coalesce(c1,c2,c3),
  coalesce(c2,c3,c1),
  coalesce(c3,c1,c2)
) least_c
from t;
C1 C2 C3 GREATEST_C LEAST_C 1 2 3 3 1 1 2 2 1 1 3 3 1 1 1 1 2 3 3 2 2 2 2 3 3 3 -
button conrol min and max range option during execution
Is it possible to change the window button conrol min and max Beach setting during execution?
Thank you very much Nick.
-
Please, advise how correctly find MIN and MAX dates.
The XML code:
Model:<DATES> <DT>2011-02-24</DT> <DT>2011-02-25</DT> <DT>2011-02-26</DT> <DT>2011-02-27</DT> <DT>2011-02-28</DT> </DATES>
The output:<?xdoxslt:minimum(DT)?> <?xdoxslt:maximum(DT)?>
Expected results:0 201102242011-02-24 2011-02-28Hello
If your data is:
- 2008-10-04
1
- 2009-10-21
3
- 2009-11-05
4
- 2008-11-10
2
The maximum is given by: / ROWSET/ROW/DT [.. / DT_RANK = count (//ROW)]
and the minimum is: / ROWSET/ROW/DT [.. / DT_RANK = 1]There may be more effective, but it works.
concerning
Jorge
-
Min and Max of the sequence number
Hello
I have a table called pins (lot number 4,
Sequence number (8)
);
I have data in the table:
batch sequence
386 100
386 101
386 102
386 800
386 801
1 387
2 387
I want to know by draw the low values and high for sequence number, is the result, I am looking
batch min (sequence), max (sequence)
386 100 102
386 800 801
387 1 2
Oracle 10g rel2
Thank youHello
You want something like this:
WITH       got_grp     AS
(
     SELECT     lot
     ,     seq_num          -- SEQUENCE is not a good column name
     ,     seq_num - ROW_NUMBER () OVER ( PARTITION BY  lot
                                                  ORDER BY      seq_num
                                      ) AS grp
     FROM    pins
--     WHERE     ...     -- any filtering goes here
)
SELECT       lot
,       MIN (seq_num)          AS min_seq_num
,       MAX (seq_num)          AS max_seq_num
FROM       got_grp
GROUP BY  lot
,            grp
ORDER BY  lot
,            min_seq_num
;
If I understand the probem, you want to GROUP BY, but many does not define groups by itself: each contiguous set of seq_nums in a batch is a separate group. In each of these groups, the difference between seq_num and a meter which reflects the order of seq_num generated in the query (using ROW_NUMBER) will be constant.
This assumes that seq_num is an integer, and this (lot, seq_num) is unique.
If this is not the case, the above query will have a small adjustment.If you want to display the INSERT statements for your sample data, then I could test this.
-
Hi all
I'm new to powercli and try to create a script to list all clusters in a data center and all hosts in a cluster and calculate min, max and avg cpu usage and ram by the host and cluster. So far, I have tried the below but I can't publish the results of my script.
$Function = @)
ForEach ($DataCenter Get-Data Center)
{
ForEach ($cluster in ($DataCenter |)) Get - Cluster)) - need help to post the information here and confirm if this is correct or not.
{
ForEach ($hosts in ($cluster |)) Get - VMHost))
{
ForEach ($vms to ($hosts |)) Get - VM)) - do not know if I called you here functions properly
{
$allvms = @)
$allhosts = @)
$hosts = get-VMHost
$vms = get - Vm{foreach ($vms in $hosts)
$hoststat = "" | Select the host name, MemMax, MemAvg, MemMin, CPUMax, CPUAvg, CPUMin
$hoststat. Host name = $vmHost.name
$statcpu = get-Stat-entity ($vmHost) - start (get-date). AddDays(-30)-Finish (Get-Date) - MaxSamples 10000 - stat cpu.usage.average
$statmem = get-Stat-entity ($vmHost) - start (get-date). AddDays(-30)-Finish (Get-Date) - MaxSamples 10000 - stat mem.usage.average$cpu = $statcpu | Measure-object-property value - average - Maximum - Minimum
$mem = $statmem | Measure-object-property value - average - Maximum - Minimum
$hoststat. CPUMax = $cpu. Maximum
$hoststat. CPUAvg = $cpu. Average
$hoststat. CPUMin = $cpu. Minimum
$hoststat. MemMax = $mem. Maximum
$hoststat. MemAvg = $mem. Average
$hoststat. MemMin = $mem. Minimum
$allhosts += $hoststat
}
}
}
}
}$Function | Select the host name, MemMax, MemAvg, MemMin, CPUMax, CPUAvg, CPUMin | Export-Csv "c:\Function.csv" - noTypeInformation
Any help on this is much appreciated.
[Ordered] casting was introduced in v3 PowerShell.
For PowerShell v2, you can use
$vms = get - VM
$stat = 'cpu.usage.average ','mem.usage.average '.
$start = (get-Date). AddDays(-31)
$report = get-Stat-entity $vms - start $start - Stat $stat - ErrorAction SilentlyContinue |
Group-object - property {$_.} @entity.name} | %{
$cpu = $_. Group | where {$_.} MetricId - eq "cpu.usage.average"} | Measure-object-property value - average - Maximum - Minimum
$mem = $_. Group | where {$_.} MetricId - eq "mem.usage.average"} | Measure-object-property value - average - Maximum - Minimum
New-object PSObject-property @ {}
Datacenter = Get-Datacenter - VM $_. Group [0]. Entity | Select the name of ExpandProperty-
Cluster Cluster Get - VM = $_. Group [0]. Entity | Select the name of ExpandProperty-
VMHost = $_. Group [0]. Entity.Host.Name
Name = $_. Group [0]. @entity.name
CpuMin = $cpu. Minimum
CpuAvg = $cpu. Average
CpuMax = $cpu. Maximum
MemMin = $mem. Minimum
MemAvg = $mem. Average
MemMax = $mem. Maximum
}
}
$report | Sort-Object-property Datacenter, Cluster, VMHost name |
Export Csv report.csv - NoTypeInformation - UseCulture
-
Hello
I need to do the calculation:
(max (min (C, 2.375), 0) + max (min(Y,2.375), 0)) / 6
If the value of c is less than 2,375 then it must accept the value of C 2,375 else.
on this, I need the operation max.
How can I do this?Looking for probably the LARGEST (de) and LESS () functions.
Remember that you may also (ROUND) your C and Y to 3 decimal places during the comparison.Published by: Slow_moe on September 25, 2008 13:14
-
Getting the values MIN and MAX of the table data
I have the table and the following records.
I need to get the highest and lowest credit / debit amount for each trans_id.create table test_bank ( trans_id number , trans_date date , trans_amt number , debit_credit_indicator varchar2(3) ) Insert into TEST_BANK (TRANS_ID, TRANS_DATE, TRANS_AMT, DEBIT_CREDIT_INDICATOR) Values (1, TO_DATE('01/17/2013 08:02:44', 'MM/DD/YYYY HH24:MI:SS'), 1099, 'cr'); Insert into TEST_BANK (TRANS_ID, TRANS_DATE, TRANS_AMT, DEBIT_CREDIT_INDICATOR) Values (1, TO_DATE('01/18/2013 08:03:02', 'MM/DD/YYYY HH24:MI:SS'), 800, 'cr'); Insert into TEST_BANK (TRANS_ID, TRANS_DATE, TRANS_AMT, DEBIT_CREDIT_INDICATOR) Values (1, TO_DATE('01/19/2013 08:03:18', 'MM/DD/YYYY HH24:MI:SS'), 500, 'db'); Insert into TEST_BANK (TRANS_ID, TRANS_DATE, TRANS_AMT, DEBIT_CREDIT_INDICATOR) Values (1, TO_DATE('01/20/2013 08:03:36', 'MM/DD/YYYY HH24:MI:SS'), 200, 'cr'); Insert into TEST_BANK (TRANS_ID, TRANS_DATE, TRANS_AMT, DEBIT_CREDIT_INDICATOR) Values (2, TO_DATE('01/22/2013 08:04:01', 'MM/DD/YYYY HH24:MI:SS'), 400, 'db'); Insert into TEST_BANK (TRANS_ID, TRANS_DATE, TRANS_AMT, DEBIT_CREDIT_INDICATOR) Values (2, TO_DATE('01/23/2013 08:04:16', 'MM/DD/YYYY HH24:MI:SS'), 345, 'cr'); Insert into TEST_BANK (TRANS_ID, TRANS_DATE, TRANS_AMT, DEBIT_CREDIT_INDICATOR) Values (2, TO_DATE('01/24/2013 08:04:33', 'MM/DD/YYYY HH24:MI:SS'), 600, 'db'); COMMIT;
I tried the SQL query below. Could you please let me know if a better solution.
Thank youselect distinct * from ( select trans_id , case when debit_credit_indicator ='db' then max(trans_amt) over (partition by trans_id,debit_credit_indicator ) when debit_credit_indicator ='cr' then max(trans_amt) over (partition by trans_id,debit_credit_indicator ) else null end trans_amt , debit_credit_indicator from test_bank union select trans_id , case when debit_credit_indicator ='db' then min(trans_amt) over (partition by trans_id,debit_credit_indicator ) when debit_credit_indicator ='cr' then min(trans_amt) over (partition by trans_id,debit_credit_indicator ) else null end trans_amt , debit_credit_indicator from test_bank ) order by trans_idHello
to get the answer, we need to know what is your expected results (showing an example).
I don't know if this is appropriate for your needs:
  SELECT trans_id, debit_credit_indicator, MAX (trans_amt) trans_amt, 'MAX' min_max
    FROM test_bank
GROUP BY trans_id, debit_credit_indicator
UNION ALL
  SELECT trans_id, debit_credit_indicator, MIN (trans_amt)trans_amt, 'MIN' min_max
    FROM test_bank
GROUP BY trans_id, debit_credit_indicator
ORDER BY trans_id, debit_credit_indicator, min_max DESC;

  TRANS_ID DEBIT_CREDIT_INDICATOR  TRANS_AMT MIN_MAX
---------- ---------------------- ---------- -------
         1 cr                            200 MIN
         1 cr                           1099 MAX
         1 db                            500 MIN
         1 db                            500 MAX
         2 cr                            345 MIN
         2 cr                            345 MAX
         2 db                            400 MIN
         2 db                            600 MAX
Kind regards.
Al
Maybe you are looking for
-
original error was "already in the process of running FF" - not the view in the task manager - not could close - restarted several times - same results - uninstalled FF and tried the download & installation of new - same message "already running." W8
-
Why is my imac printing docs pdf with squares instead of text
I use OS X 10.9.5. When I want to print a pdf document was sent to me from an external source (for example, my electricity bill) the document is printed with squares where the text should be. Sometimes if I get an overview of printing, it will look O
-
ThinkPad Edge S430 - is possible to replace the hard drive with an ssd?
Hey, Lenovo,. I bought a Thinkpad Edge S430 and wonder if it is possible to replace the hard drive with an ssd? Kind regards Mikael
-
My games of windows 95 are incompatible.
cannot play any of my ole favorite :(games on all previous versions of windows, as I could, n I have possessed all, even if they are 16-bit from my days of windows 95, they played fine on 32 bit systems, but now on 64 I'm out of luck, unable to enjoy
-
I would like to replace my DVD drive internal stock (599062-001) with a Blu - ray player. Partsurfer site does not list a Blu - ray drive for my computer laptop, g62-455dx, but I don't see Blu - ray discs for other models g62. Specifically, I see t