block size / real-time
Hello
I know that some of you have already had this kind of problem, and I tried to solve the mine with your solutions, but it work yet... My problem is the following: I have to stop acquisition with a global variable of pre-definied. At the beginning of the program to choose the acquisition (in second) time, thanks to the action module. Then begins as and when the program notice a variation of the input (defined), he begins to write values to a folder and save the data.
After the relay module, I put a module based on the time and choose "measurement in second time. The statistical module take the max and min and then do a subtraction (max - min) to get the real acquisition time (which begins with the combi-relaxation). I use the formula In (0) > global variable (pre-definied) and then an action that stops the measurement when the variable global (acquisition time) is more than.
I want to have 2 seconds of time of acquisition, but the routine often stops around s 2.047, but is not specific enough (with the size (512) to block automatically to 1000 Hz)... So, I tried to change the basics of time for block size = 1 and sample rate = 1000 (for all: driver, dasylab and acquisition card). But now the acquisition time doesn't seem to match with the real time...!
For more information, I use:
USB 1608G (MCC - DRV)
DASYLab 12 (evaluation version).
If you have an idea of what I need to do... An accuracy of 1 ms would be great (as a block size of 1 with sampling frequency of 1000 Hz...)
I joined the worsheeet below for a better understanding.
If it could be useful to others... (Fortunately ^^) I found the solution!
I used the Basic module of time, I chose "time of day" and then, I put the module 'statistics statistical values' and I take the max, min. After that, I put an arithmetic module and "max - min".
I hope it's ok, but it looks like the right way to find what I was looking for...
Tags: NI Products
Similar Questions
-
data from the buffer before graph it and block size
I hope you can help me with this situation because I was collapsed in this situation for two days and I think I see the light in the short time and time is a scarce resource.
I want to use a NI DaqCard-HAVE-16XE-50 (20KS/sec accordig to the specifications). For data acquired by DasyLab, I use OPC DA system but when I try to get a graphic from the signal I get ugly results.
I guess the problem is that the PC is not powerful to generate a graph in real time, is if there is a block to save the data, then graph the data without using "write data" block to avoid to write data on the disk?
Another cause of the problem, it might be an incorrect value for adjusting the size of block, but in my piont of view with the 10 kHz and 4096 block size is more than necessary to acquire a signal of 26 [Hz] (showing the photo). If I reduce the size of the block to 1 signal showing in the graph is a constant in the first acquisition value. Why might this situation?
Thanks in advance for your answers,
You don't want to use OPC DA for a device installed with the material. OPC DA is designed for industrial devices low speed, not for cards installed 20 kHz!
Rerun setup of DASYLab and select the OR-DAQ driver, deselect the NOR-DAQmx driver.
You must use the analog input OR-DAQ module for talking directly to the camera. You will get the full speed of the device, and the buffering is managed properly.
I have this card somewhere in a box, and when I used it, it worked perfectly with the NOR-DAQ driver.
-
Reduced block size but no big change on the disk storage
Hi all
This is my first post on this forum and I hope that I won't have any rule of Recommendation to report a question completely distinguish...
I need your advice on the disk storage of a BSO cube, here are the details:
Make tests on a cube of OSI, I reduced the size of the block of 76 032' to 11'232 bytes. Then, I was interested to check if the disk storage has been reduced... So, I took the same set of data and loaded into the old structure as well as in the new structure. For both structures, I have applied exactly the same calc script + has not changed any other settings (such as "cache" for example).
When I checked the results, I was really surprised because with the same set of data, it must 13go to the old structure and still 10 GB for the new even if the size of the block is really small... I've heard that "compression" could play a role here, but except for the compression, you have an idea of the reason why the disk storage is not smaller whith the new block size?
Thanks in advance for your different tips and best regards,
LaurentP.S: the density is not very good because I tried to do tests on a smaller data set than the real...
^ ^ ^ You just stated that all of the data is not representative and is actually smaller than reality. So that means you load (approximately) the same set of data in large blocks and small blocks. Guess what happens when it is compressed...
To answer your question, the real test would be, for a number of limited but representative of blocks (good luck with that one), blocks of size reduced and complete tests. That will give you real world block size.
BTW, I'm guessing / hoping that you did all members of dense upper level dynamics. There is almost never (well, sometimes, but really very rarely) a reason to store the dense upper limbs at level. A large part of the time forms dense member of lower level can also be set to dynamic.
Kind regards
Cameron Lackpour
Published by: CL on May 7, 2013 08:44
"I can't type of coz. -
Analyzers of vector signals OR, in real time of tektronix and tests EMC spectrum analyzers
Normal
021
fake
fake
fakePT - BR
X NONE
X NONEMicrosoftInternetExplorer4
/ * Style definitions * /.
table. MsoNormalTable
{mso-style-name: "Table normal";}
MSO-knew-rowband-size: 0;
MSO-knew-colband-size: 0;
MSO-style - noshow:yes;
MSO-style-priority: 99;
MSO-style - qformat:yes;
"mso-style-parent:" ";" "
MSO-padding-alt: 0 cm 0 cm 5.4pt 5.4pt;
MSO-para-margin-top: 0 cm;
MSO-para-margin-right: 0 cm;
MSO-para-margin-bottom: 10.0pt;
MSO-para-margin-left: 0 cm;
line-height: 115%;
MSO-pagination: widow-orphan;
font-size: 11.0pt;
font family: 'Calibri', 'sans-serif ';
MSO-ascii-font-family: Calibri;
MSO-ascii-theme-make: minor-latin;
MSO-hansi-font-family: Calibri;
MSO-hansi-theme-make: minor-latin;
mso-fareast-language: EN-US ;}1. how to work if vector performance of or
Analyzers of signals compare to Tektronix real-time spectrum analyzers?2 can you emulate Tektronix FFT
processing overlapping?3. is it possible to use vector of NOR
Analyzers of signals of compliance EMC and/or test preconformite? Is there some
companies use it successfully? Need a special or custom software?Thank you
Hi emc2006
I'll answer your questions separated by your topics:
1 - What is the factor that you want to compare between these two products? In the link below, you will find the performance of the NI PXI-5660 RF Signal Analyzer system.
2. you can develop this feature of programming in software Application development, i.e. of LabVIEW.
3. Yes, NI´s vector signal Analyzer could run preconformite or EMC compliance analyses. In the same link below, you will find in the subdivision of Applications.http://zone.NI.com/DevZone/CDA/tut/p/ID/4298
Concerning
Napoleao
Application engineering
National Instruments -
Time base / real-time display problems
I am under a layout with no hardware and simulation takes 5 X longer than expected. But when I exit graph it shows the correct output! Is there something to put in place the basis of time?
The installer is completely relevant.
Sampling rate 1000 and block size 1 will bog down the software to the point where it gets behind. Because there is no equipment, you don't get a driver error... but you would. In this case, it is just work really hard. The timestamp is based on how the time of module of data generator assigned.
1000 and 10 is almost as bad.
I would really like to see the spreadsheet... There are modules, such as the average module, that may need to adjust the size of the block down.
-
Able user to zoom in/out the image in real time the performance of façade?
Well I have searched this and have developed empty. What I would do, is to have a picture of a diagram on the front panel and during execution of the VI user can somehow zoom in/out the image in real time.
I know there is something that is called Zoomfactor that you instantiate a way in the block diagram, but that seems to zoom in on a picture of race prior to the program. The zoom is not in real time. There is no possibility of real user to zoom in/out with free will, using the Zoomfactor I see. (Sorry I forgot display name of the service). And I saw messages by a man named George Zou that seems to come with a VI which is closest to what I want, but I pulled the VI site seems not compatible with my computer (my rig is under XP with Labview 2013 currently). So, I was wondering if someone else had found other answers appropriate to my specifications?
Use a structure of the event to change magnification during execution.
You can even program your own shortcuts to the structure of the event, for example if the user clicks on a particular point on the picture and you read this coordinate on, and you zoom way at this point remains in the Center... There are many options to play with...
-
Continuous data acquisition and real-time analysis
Hi all
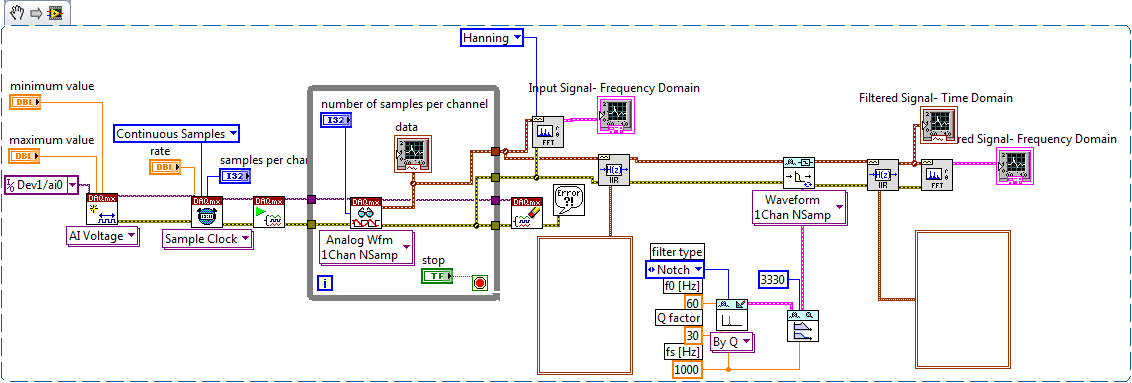
It is a VI for the continuous acquisition of an ECG signal. As far as I understand that the analog read DAQmx VI must be placed inside a while loop so it can acquire the data permanently, I need perform filtering and analysis of the wave in real time. How I implemented the block schema means that data stays int the while loop, and AFAIK the data will be transferred on through the tunnels of data once the loop ends the execution, it clearly isn't real-time data processing.
The only way I can think to fixing this problem is by placing another loop that covers the screw scene filtering and using some sort of registeing shift to transmit the data in the second while loop. My question is whether or not it would introduce some sort of delay, and weather or not it would be supposed to be the treatment in real time. Wouldn't be better to place all the screws (aquicition and filtering) inside a while loop? or it is a bad programming practice. Other features I need to do is back up the data I na file, but only when the user wants to do.
Any advice would be appreciated.
You have two options:
- A. as you said, you can place the code inside your current while loop to perform the treatment. If you're smart, you won't need to put one another while loop inside your existing (nested loops). But it totally depends on the type of treatment that you do.
- B. create a second parallel loop to perform the treatment. This would be separate processes to ensure that the treatment is not obstacle to your purchase. For more information, see here .
Your choice really depends on the transformation that you plan to perform. If it's much the processor, this could introduce delays as you said.
I would recommend that you start at any place in the first loop and see if your DAQ buffer overruns (you can monitor the rear of the buffer during operation). If so, you should decouple the process in separate loops.
In what concerns or not ' it would be considered as real time processing ' is a trick question. Most of the people on these forums say that your system is NEVER in real time because you're using a desktop PC to perform processing (note: I guess it's the code that runs on a laptop or desktop?). It is not a deterministic systemand your data is already "old" by the time wherever he leaves your DAQ buffer. But the answer to your question really depends on how you define "real time processing". Many lay it will set as the treatment of 'live' data... but what is "actual data"?
-
cumulative subtraction on real-time data
Hello
I'm new to LabVIEW and have a fundamental issue in the case. I am acquiring data on the frequency of multiple CHOICE which I want to treat in order to display the change in mass on a graph in real time!
I have a formula that says f1 - f2 = const * dm (dm is the change in mass)
So I want to calculate f1 - f2, f2 - f3, f3 - f4 and so on... I know the concept of shift registers, but am not able to implement in my circuit
I have attached the VI. Please guide me.
Thanks in advance!
Hi netra.
'circuit' is called "block diagram" in terms of LabVIEW! It is a programming language and no designer of electronic circuits...
In your VI I place no 'f', 'mass', 'frequency' or 'Multiple CHOICE' indicators. It is really difficult to follow your VI when your description does not provide any useful information.
Create a shift register in your loop. Store the current value in the shift register. A subtraction to calculate the difference of current and previous value:

The same solution is displayed using a feedback node instead...
-
Error-307650 during a sequence in real-time with API LV
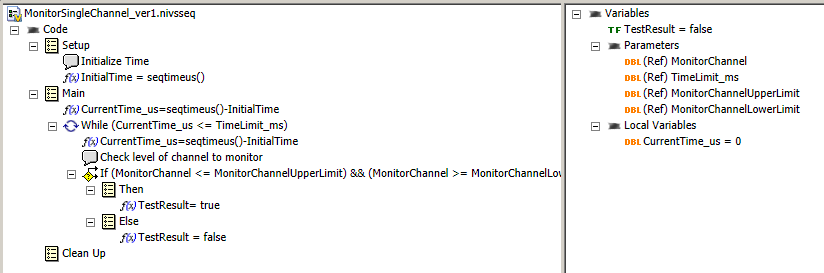
I created a basic real-time sequence that checks the time it takes a signal reach a certain threshold.
On the side of the LV, I use the API to call this sequence. I make sure that all channels and settings are defined as in the examples. However I get 307650 error that says "NEITHER VeriStand: Index was out of range." Must be non-negative and less than the size of the collection.
' Parameter name: index.
Any suggestion to help here? THX. Code is attached.
There are two problems here:
1. The Stimulus profile editor is not indicating that there is an error with this sequence, although there is a. Note that the variable InitialTime is used in an expression, but is not declared as a parameter or a local variable.
2. you get an error at runtime because of it, but it's not terribly useful (index out of range).
You can fix this by adding a local variable of InitialTime to your sequence. I dropped the CAR 338386 about this bug.
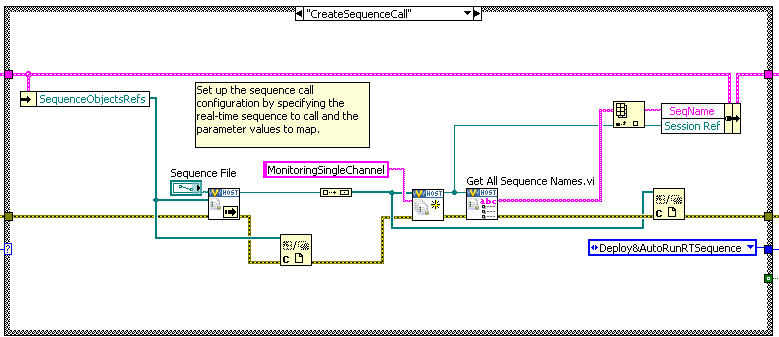
Once you do this, there is something extra, you will need to set in your VI which runs the sequence so he could get the results of the sequence properly. You use correctly the value of the sequence name to read the back of the sequence Variable. You use the Session name used during the deployment of the sequence. Which does not match the name sequence.
To get the name of the sequence, use VI to get all the names sequence on your session profile of stimulus to get the array of names for all of the top level of the session sequences, then index on the first point, given that you only use a single sequence. Example below:
-
We want to start by using the Toolbox in real-time to backtrace of memory allocation profile on a target of cRIO 9035 & 9039.
The product information (http://sine.ni.com/nips/cds/view/p/lang/nl/nid/209041) page has a note indicating that the Toolbox has limited functionality on real-time OR-Linux supported targets.
However, I couldn't find any specific details about what are these limitations.
If anyone can clarify which restrictions apply?
Are there alternatives (party packages) that offer a feature more complete?
Hello Jörn,
Did some more research, the following limitationrs occur on targets LInux RTOS,
-The Manager of memory when used on targets of Linux, saves only data for LabVIEW processes and threads, not the global memory of the systems.
-Wait object are not recorded events
-Trace buffer size cannot be changed
-Timed loop pre-emption and reactivation of SRI events are not markedHope that this information helps out you in addition,
Kind regards
-Natalia
Technical sales engineer
-
How is it you can't use more than 126 GB of a 1.5 TB with LabVIEW Real-time hard drive?
How is it you can't use more than 126 GB of a 1.5 TB with LabVIEW Real-time hard drive?
It's only 8.3% of disk space!http://digital.NI.com/public.nsf/allkb/E7E2F5657B6026358625750B007201A6?OpenDocument
The national Instrument is reformat that you drive less than 126 GB or replace the drive with a less than this size.
Please OR tell me you go fix your LabVIEW Real Time soon, and that we will not have to wait for LabVIEW RT 9.2.1 in 2011 for this one to fix.
http://upload.wikimedia.org/Wikipedia/Commons/9/90/Hard_drive_capacity_over_time.svg
Readers as high as 126 GB or more have been around since mid-2002. It's about 7 years now and LabVIEW Real-time STILL cannot use greater than 126 GB drives! Please OR. Do something.
We deserve the patches for older versions of LabVIEW RT. What about updates to LabVIEW RT. As 7.0.2 7.1.2 7.6.2, 8.0.2, 8.2.2, 8.6.2.
We don't need new features or versions of LabVIEW RT as 9.0 until we have some of the bugs fixed in existing versions.
Kevin.
-
Hi all
I am trying to create a spreadsheet of the 500 columns and 1000 lines.
My program consists of real-time data streaming via the com ports (VISA), running in a continuous loop. I was hoping that someone could help me with the following:
(1) how to convert point-by-point of data in a table format?
(2) how to put in place the iterations and loops for the program to collect 1000 samples of data and then move to the next column (switching 500 times columns)
(3) how can I take my array 1000 x 500 and write it to a spreadsheet?Most of the examples that I find to create rows and columns of the tables use random number vi, incorporated into the INSIDE of a loop for, and then auto-indexation it. However how I incorporated my data in real-time (within a while loop) in a loop for (that's why I'm unable to follow these examples).
I'm new to LabView fairy. I would be great if someone could help me because I've tried countless ways to create my spreadsheet.
Thank you!
Would be easier to collect the data in a table 1 size d 500000 (= 500 x 1000). Initialize an array 1 d of this size and the correct data type and use it to initialize a shift of you register acquisition loop. With each new data point, use 'replace the subset of table' to replace the actual data based on the final iteration. When the acquisition is done, reshape the array to 500 lines. 1000 columns and write it to the file (using for example write to the spreadsheet file).
Why do you use a while loop. Apparently, you know the number of iterations before the start of the loop, a loop FOR would be more appropriate (you can view the conditional terminal to stop earlier if necessary)...
Be aware that it is expensive large format paintings. Unless the ihe file must be imported somewhere else, I recommend using binary files.
-
Hi I have measured data using a SELF-DIAGNOSIS device and that you have downloaded the log files as a .csv I have attatched below. I'm trying to read the 7th column of data (RPM) and display it on a waveform graph, read line-by-line to simulate driving real-time data. The interval between readings, I'm trying to achieve is 500 Ms because it is the time interval of readings on the worksheet. I'm finishing the two loops when rpm is equal to zero, as happens when the car is off. I have attatched the relevant section of my program below. Any suggestions would be greatly appreciated.
Thank you
Michael
There are two errors in your block diagram. First of all, as you read the entire table 2D in all at once (which is fine), you make a clumsy (pardon my language) job to make a line of programming. Once you take the first line of headers, you have the ideal substrate for a loop, which is made of elements of an array (lines) process, one at a time, using its tunnel of indexation.
The second mistake is to forget data flow. The loop, I mentioned, or the While loop you use, produced one at a time and points it at 2 Hz thanks to your expectation of 500msec. You want to give each point to your chart, but the picture is out of the loop, which means that there is No point until the loop ends.
Here's an easy Question - where you put the indicators in table of waveform? [Council - I said that "outside the loop is bad"].
Bob Schor
-
Algorithm of PID in 'PID and Fuzzy Logic Toolkit' and 'real time Module ".
Hi all
I am recently using LabVIEW 2011 and 2011 real time Module. My application requires the PID control.
Now, I have a problem. In the manual for "And Fuzzy Logic Toolkit PID", Chapter 2 "algorithm PID" it indicates non-interactive algorithm (also called the ideal algorithm, Standard or ISA) be used in all the screws of PID in the Toolbox. It seems that Yes from source code. However, in Chapter 3, "Using the PID software" arrays of calculation of PID parameters based on method of Ziegler-Nichols, which was developed for the interactive algorithm (also called the series, the real classic algorithm). D action has been included in the scheme of control, the settings may be different for the two algorithms. In fact, Cohen Coons and adjustment PID Lambda rules can be used for the algorithm used by the box tool with no conversion.
In addition, there is a PID function block comes with the real time Module, and I know not what PID algorithm it uses. Can someone help me?
Thank you in advance.
Su
In the "and Fuzzy Logic PID Toolkit, we use the University structure to implement all algorithms. Tuning techniques we show on the manual to express the original work and we try to keep the same as you would look at the literature. However, in our implementation of autotuning internally converted to the structure used by our algorithms to keep compatibility with our own implementation.
If you use an external source, you can use the Conversion.vi of Structure PID to change University, parallel or series of parameters in one used by our algorithm.
The PID included with the real time module is a 'copy' of our algorithm, and they have the same settings and behavior. The only advantage to use this function block, you have access to the parameters through variables.
Hope this helps...
-
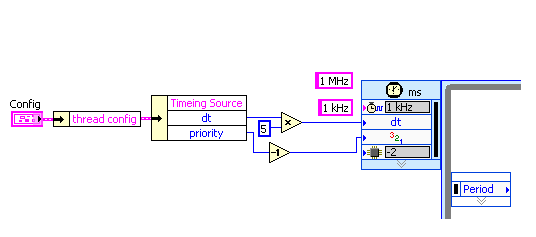
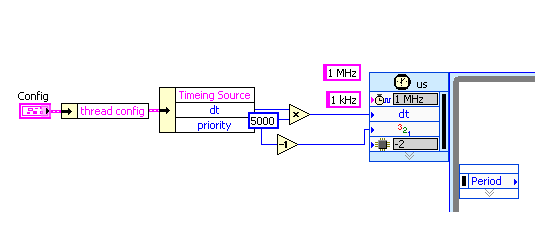
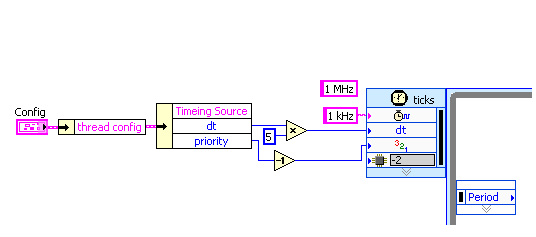
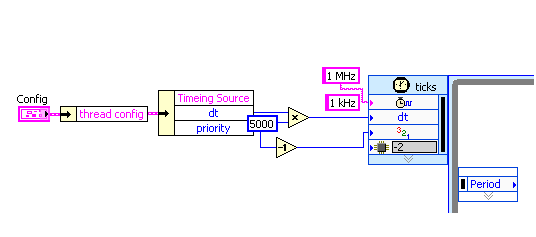
"1 MHz" for the name of the source on the time loop does not work on LabVIEW Real-time 9.0
A Loopis Timed running as expected if a time source is manually chosen in the dialog box of configuration for "1 kHz" (first digit) and "1 MHz" (second digit). If the time Source name is set through the input of the channel "1 kHz", the loop is executed, too third figure). But if the input string is "1 MHz", the loop is not executed (last figure). The channel two are created by "create constant" on the entry of the loop to exclude typos. Is it possible to set the Source of a loop time timed through the input string to the real-time clock hard Mhz?
OK, I was a bit confused by the difference between the behavior of error...
Now, the question is quite clear. Aid for the timed loop provides the following regarding the Source of the calendar entry:
Specifies the name of the synchronization source to use to control the structure. The source of synchronization must be created using the create synchronization Source VI on the block diagram or selected in the dialog box Configure the timed loop .
So, I think that you have somewhere in your code a time Source.VI create if you pass "1 kHz" as the name. But you did not do this for your clock "MHz 1"...
hope this helps,
Norbert
Maybe you are looking for
-
My new 4502 envy was working fine until I loaded the software on the drive. Now, I try to print, and it gives me junk on the paper and then stops and gives me the 0XB3B207B6 error Code. Can someone help me get out of this mess? I can't even stop t
-
Why don't I do drag and drop photos in real size of more attachments in the new Windows Live Mail?
I am a real estate photographer, and one of the things I have to do on a regular basis is to send pictures to people. They need these photos as attachments. I downloaded the new Windows Live Mail and I noticed that I can't not simply 'Drag and Drop'
-
Problem to download a video file on facebook
Having problem download the video file on my facebook account. Download horizontal bar does not appear. But when I try it on another computer, it works. I use a laptop computer with the version of Windows 7. H K Tan
-
[Cisco] FAQ - How can I copy my programs saved to my DVR to my PC?
Can I move my DVR to my PC hard drive copies?
-
I received an email on the new Microsoft service contracts, changes that will take place on 19 Oct. I did not open the link. Is it a scam?