Butterworth filter without phase shift
Hello
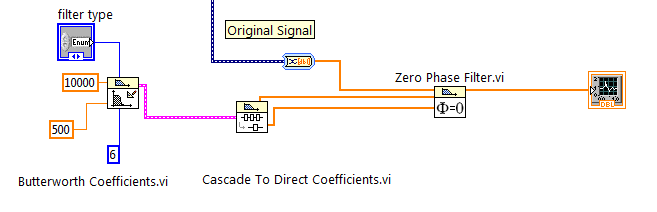
I would like to design a 6 without a phase shift of order butterworth filter on my signal. A cutoff frequency of 500 Hz was chosen with a sampling rate of 10K Hz
Solved! Thank you ADE77
Tags: NI Software
Similar Questions
-
With the help of a Butterworth filter without phase shift
Hello
I found this reference to the use of a Butterworth filter without phase shift http://zone.ni.com/devzone/cda/epd/p/id/2775 but I can't open the sample with LabView 2011. Can anyone help? The referenced file is attached.
Is there another or the best way to do this?
Thank you
Attached is a version saved in LV2009.
In such cases, you can validate the vi to the discussion of queries VI Upconvert.
Ben64
-
the power of the spectrum graph and butterworth filter
Hello
I am beginner in labview, I want to see the power spectrum of the sound samples, I want to see if there is any reason in these samples.
I use spectral measure, and then I filtered with butterworth filter samples. For output I using waveform graphs.
Before filtering the signal, I'm in the x axis of the graph between 0-22500 and the data mostly in 0-2500.
I've tried to filter using these values (fs = 1000 Hz, 0.125 hz = fl and fh = 500 hz) and the graphics almost the same thing but the axis of the graph is between 0-0, 5.
issues related to the:
What is the x axis properties? Why is different, but the graphics are the same?
Make the mistake with the program?
Hi Limavolt,
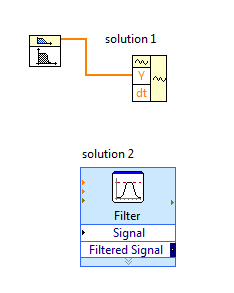
You have a problem with the bandpass filter VI, this VI generates only the signal of value i.e. table DBL. The signal is a cluster.
solution 1: you need to calculate 'dt' using the sampling frequency and use VI waveform construction to generate a signal's own scaling.
Normally, dt = sampling frequency/No. samples
Solution 2: replace the VI butterworth filter with filter VI express, this will produce signal without scaling.
-
Transformed Hilbert phase shift of 90 degrees
I am usig transformed from Hilbert to provide me with a shift of the phase of the signal of a UHF radar unit.
When I try to get the soft wave phase I get nothing. But when I replicate the output of the HIlbert and do a sinus I have the orginal without the phase shift wave.
When I use a simulated sine wave and use the transformed Hilbert for her, I get a wave that is shifted by 90 degrees.
So can you please help me with some splitters using Hilbert.
There the best solutions for the phase shift?
If you get a point at a time, use the version ptbypt as already mentioned. It includes a configurable size buffer.
-
How can I determine the best order to execute my butterworth filter at?
I'm low-pass filtering of a signal that has been sampled at 200 Hz through a butterworth of 40 Hz. I need determine the optimal filter order. How can I create a quantitative comparison of the effects of filter butterworth on frequencies above 40 Hz according to various order?
I tried using the FFT to create a graph in the space of the frequencies, but do not know how to proceed. Any help would be greatly appreciated. I want to compare what the path immediately before and immediately after the butterworth filter.
Also there is another way to read in a column of numbers from a text file without using reading the measurement file Express VI?
Ok
Standard of comparison filters for roll-off slope is to consider the report of the frequencies to two different attenuations. In general, this is done to-3dB and something else by example-60 dB. You have your data plotted in a linear way. Maybe just by looking at the f(@0.75)/f(@0.25 report) would be sufficient for your needs. Looking at your images: order 2 f(@0.75) ~ = 38. f(@0.25) ~ = 60. Ratio = 1.58. Ratio of the order of 10 is 39/42 = 0.93. If you want more big numbers for best performance use inverses.
Lynn
-
phase shifted PWM with Ni 9401 and Crio
Hello
Do you have an idea of pwm shifted 180 degrees?
(duty cycle frequency and variable difficulty)
I tried a design, but it seems in the graphics design works on the realtime.vi but it does not work with the fpga.
Graphic output pwm FPGA are distinguished by the real time as you can see in the pictures.
On the other hand, VI Fpga produce two pwm, as seen in the oscilloscope when the fpga VI runs.
However, there is no phase shift between the PWM waves.
It is a part of my thesis, but I'm stuck in this problem, so I need assistance on your part.Thank you.
Best regards;
My hardware:
cRIO-9024 and cRIO-9118 chassis
NOR-9223, 9263 - nor, nor-9401, or-9474
two nor-9225 and nor-9227
Hi Maurice
Thank you for your help.
Yes I want to that they will be moved with the right variable and 10 kHz. I put 49% maximum duty.
I put the output into the same output block.
Square wave generator does not accept 'loop' while.
I have attached a simple FPGA project file. Could you please tell me what is my fault?
The resulting Pwm frequency is 10 kHz, the only problem is always the shifters.
So, I always need assistance.
-
Hello world!
First of all, I use a USRP as a transmitter to emit a sine wave (the signal is exp(j2*pi*f*t)), and then I use the external clock to synchronize the two USRPs (Ref as PPS in are connected to the clock) as receivers. Receivers are in sync, and they are at the same distance from the transmitter, I thought that the signal they receive should have a nearly the same phase. However, in practice, the phase shift is big enough, and this problem really confuses me.
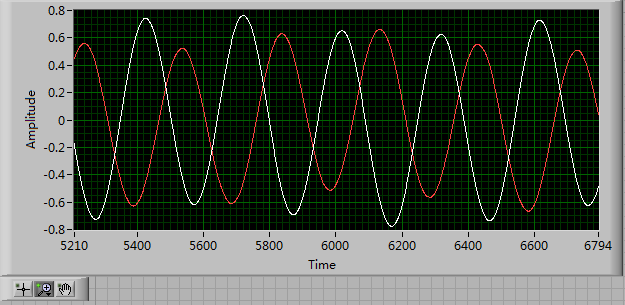
It's the received signals of 2 receivers.
Yes. What you observe is expected.
Near the bottof of this document read the area 'alignment Phase vs Phase coherence '.
http://www.NI.com/white-paper/14311/en/
And also, for the alignment phase, see the following 'Angle of arrival detection with NI USRP '.
https://decibel.NI.com/content/docs/doc-25716
Erik
-
How to make 'F1 to F12' like hot keys without pressing SHIFT
Nice day
I had been using HP pavilion window of Core i7 8 over the past 18 months. I found it difficult to use F1, F2, F3, F4, F5, F6 and so forth as the keys without pressing the key 'SHIFT' then F1 to F12. Please how can I fix my F1 to F12 as the keys without pressing SHIFT?
Thank you
Hello
Do you mean the fn + f key combinations?
If that is correct, you can change the default behavior as follows.
Shut down the laptop. Tap away at the esc you key start Notepad to open the Start Menu. Select the Bios ( f10 ) option, and then change the figure in the document at the following link.
http://support.HP.com/us-en/document/c02035108
Kind regards
DP - K
-
Phase shift a channel and display
Hello
I'm working on a project for which I have to display the I-Q constellation plot and normalize the data to fit a circle of unit RADIUS.
I'm able to do this, but the problem is sometimes the signal in one of the channels is very low and therefore, the plot moves close to the routes (Please find attached the file, this is the best position, if a channel has a weak signal, the movements from point to one of the axes). When this happens, I want to add a phase shift of the signal (45 degrees and multiples of it) to bring to the back for the best position. I tried to use the extracted tone vi phase go, add 45 degrees, but how to rebuild the spirit of the new signal phase?
Can someone help me please?
Thank you very much
Despres
-
variable phase shift between two analog output signals
Hey! I would drive two different piezo elements with an sine - / square signals and have a phase shifted output signals. After some trail and error, I was able to get a second analog output on my card PCI-6221 (using LabView 8.2) also allowed me to have different amplitudes for both signals. However, I could not output signal having a frequency different and most importantly to my request to have one of the signals variably shifted phase.
Thanks for the very useful suggestion. I have attached the file .vi installation I've run so far.
Hello!
A way to generate waveforms is using the analog waveform Toolbox. I created an example VI that is attached and that shows you a way to use the base generating function VI. I saved for LabVIEW 8.2.
I hope this helps!
-
Align the two signals and measure the Phase Shift
Hello
I do an experiment in which I use the NI USB-6221 DAQ card. The jury is able to make 250 k samples/second. I want to measure two voltages in a circuit and find the phase shift between them at frequencies between 1 and 10000. First I ouputted a wave sinusoidal frequency variable through the Commission and applied to a test circuit. Then I used the Board to measure the two tensions consecutively (thus reducing the maximum sampling frequency at 125 k). I used the signals align VI and measured the two phases and then calculates the phase shift (VI attached in Phase 1). It worked well for the test circuit I built in which the phase shift went way logarithmique.20 degrees ~84.5 degrees and then stabilized. At frequencies above 5 000 Hz phase shift must have remained constant, but it varies more or less 1 degree. When the phase shift is 84.5 degrees, present a degree of variability is not particularly explicit. When I asked my program on the circuit that I really wanted to measure, the phase shift went from-. 5 degrees up to about 1.2 degrees. The change in the values of phase shift at high frequencies (> 3000) was environ.2 degrees. Given the small phase shift, this variation is unacceptable. Now I tried to use a sequence to each blood individually (increase the maximum sampling frequency to 250 k) and then align the two signals and measure the phase of each shift. When I use align it and re - sample Express VI to realign the two signals, I get the message "error 20333 analysis: cannot align two waveforms with dt even if their samples are not clocked in phase." Is it possible to align two signals I describe here? I enclose the new VI as Phase 2
Matthew,
I think I have an idea for at least part of the problem.
I took your program data and deleted stuff DAQ. I have converted the Signal on the chart control and looked then what was going on with the signal analysis.
The output of the Waveforms.vi line has two waveforms, like the entry. However, arrays of Y in the two waveforms are empty! It does not generate an error. After some head scratching, reading the help files and try things out, that's what I think is happening: the time t0 two input signals are 1,031 seconds apart. Since the wavefoms contains 1,000 seconds of data, there is no overlap and may not align them.
I changed the t0 on two waveforms are the same, and it lines up. The number of items in the tables is reduced by one. Then I increased the t0 of 0.1 seconds on the first element. The output had both greater than the entry by dt t0 t0 and the size of the arrays was 224998. Reversing the t0 two elements shifts the phase in the opposite direction.
What that tells me, is that you can not reliably align two waveforms which do not overlap.
I suggest that you go to 2-channel data acquisition and that it accept the reduced sample rate. You won't get the resolution you want, but you should be able to tell if something important happens.
You may be able to improve the equivalent resolution by taking multiple steps with a slight phase shift. This is similar to the way that old oscilloscopes of sampling (analog) worked. Take a series of measures with the signal you are currently using. The make enough average to minimize changes due to noise. Then pass the phase of the signal of excitement to an amount that is smaller than the resolution of phase of sampling rate and repeat the measurements. Recall that I calculated that for a 5 kHz signal sampled at 125kHz, you get a sample every 14.4 degrees. If shift you the phase of 1 degree (to the point/mathematical simulation), you get a different set of samples for excitement. They are always separated by 14.4 degrees. Take another series of measures. Transfer phase another degree and repeat. As long as your sampling clocks are stable enough so that frequency does not drift significantly (and it shouldn't with your equipment), you should be able to get near resolution of what you need. The trade-off is that you need to perform more measurements and may need to keep track of the phase shifts between the various measures.
Lynn
-
Phase Shift Key: Modulation Toolkit
I am trying to simulate a phase shift key, I have followed an example of OR. the example worked fine and I used the same code but does not work my didi. The number of symbol is not correct.
I have attached the VI, I could not know what the problem was. The chart of the constellation should remain constant, rather than moving and the number of symbol in the chart must be equal to the symbol on the control.
Thanks for any help.
Hello ade77
Thanks for your post. It seems that your Eb/NO (10 dB) value is not high enough to get the right number of symbols in the right place. Try to increase this number and see if that helps. See the screenshot of your attached code.
Let us know if this helps!
See you soon!
Corby_B
http://www.NI.com/support
-
How can I get the Coefficients of scaling for the Butterworth filter FPGA version
I am trying to program a FPGA application where I need to be able to change the cutoff frequency of the filter. I see that I can do a terminal for the coefficients of the filter on the VI express Butterworth filter, but how to generate the coefficients of different cut-off frequencies of filter? When I use the VI of Coefficients of Butterworth host-side small floating-point values rather than the large fixed point values I see on the side turns FPGAS.
Thank you
David R. Asher
Hi David,
8.5 or 8.6, there is an example of navigation that contains the Subvi design filter you need:
examples\R Series\FPGA Fundamentals\Analysis and Control\Filter and filter Butterworth Reconfigurable DC-RMS\Using-R - series.lvproj
In LabVIEW 2009, there is a new palette in my computer: Interface FPGA > scaling, with a new VI of Coefficients of Butterworth on this subject. Who will produce the coefficients quantified, you need in the format expected by the FPGA Butterworth filter.
Kind regards
Jim
-
FPGA Butterworth filter - why conversions to decimal fixed?
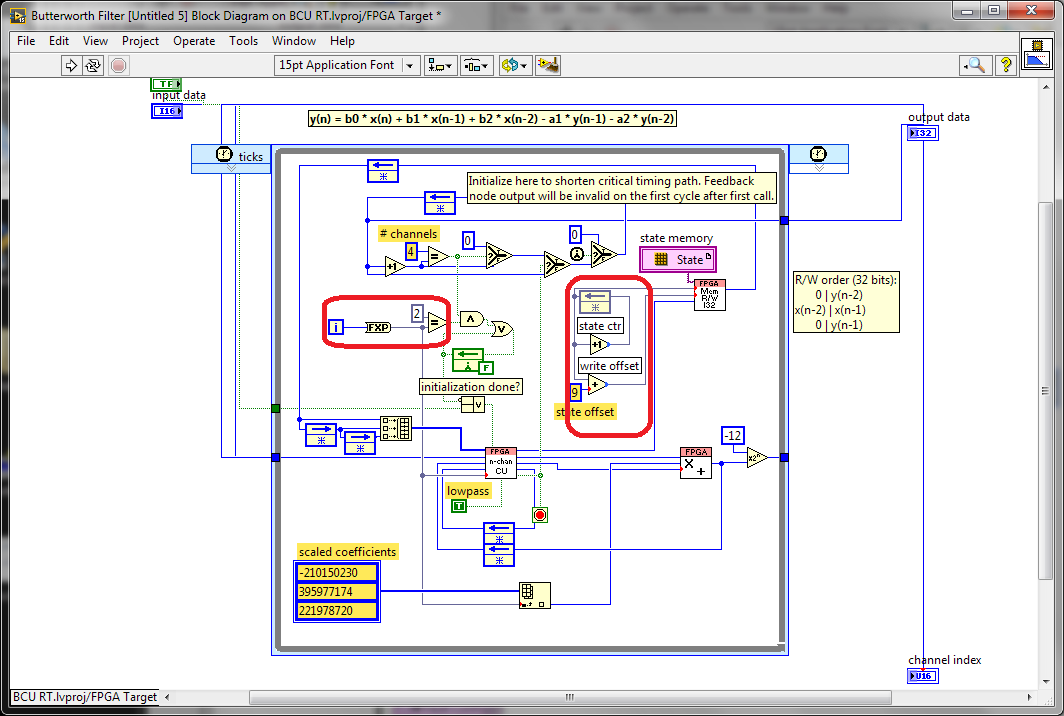
I was looking through the screw FPGA Butterworth filter Express and stumbled on this code (after conversion the Express VI into a Subvi and then by opening the front panel):
What is happening with the conversion to decimal fixed values that look like they must be integers (in the red boxes)? Why these conversions would be useful?
Here is the micro-optimisations to help the synthesis tools to minimize the number of bits used in these code paths. The iteration Terminal is 32 bits wide and also involves a logic to do in the face of what is happening when the maximum value is reached. We have seen some benefits from the reduction of this path to the minimum width required both that which is written. I think it is probably still the case since the compiler usually does not know how many times a given line will run with a dynamic stop like this condition.
The optimization of the meter width is similar, taking advantage of the fact that we know that we have limited storage space to use circular buffers power-of-2 size. Using the exact number of bits of the address allows us to implement a counter of reversal with no additional logic. otherwise, we would need to check the value, and add a mux (Select) to reset the counter when it reaches the maximum value.
Synthesis tools usually do a good job of optimizing the unused bits, but here are two cases where we can help them by being more explicit about what we really need.
-
I want to build a Butterworth filter with the node of the formula. What should I do?
We will do it step by step, and if you can correct me.
I have seen that the formula for the Butterworth is:
H (JW) = 1/sqrt ([1 + (f/CF) ^ 2N])
now, I know that the cutoff frequency is CF = 1 /(2*pi*R*C) where R & C are variables and selected by the user (that's what the professor asked).
So, if I write in the node formula this statement:
Tau = R * C;
CF = 1 /(2*pi*Tau);FdT = abs (1/sqrt ([1 + (f/CF) * 2 * n]));
I got error. Why?
You were close. But your small loop inside the formula should look like this. Notice the perithesis around the 2 * n. You were just squaring. You should raise to a power of 2 * n. I've added an entry for the number of poles.
for ( f=0; f<1000;f++)
{
  H[f]=1/sqrt(1+(f/Fc)**(2*n));
}
Also, is there an absolute value in the digital palette. Use instead of the square and the square root.

Maybe you are looking for
-
IE and Chrome works on Gmail, but Firefox get error on CookieMismatch
I get the error message below. I did all the elements, but still not able to connect to gmail unless I have use private browsing. We have detected a problem with your cookies settings.Enable cookiesMake sure that your cookies are enabled. To enable c
-
Satellite L300 - cannot install Microsoft updates after replacing HARD drive
I am repairing a Satellite L300, which had a dead HARD drive. I replaced death 160 GB of HDD with a 500 GB WD, then used the recovery disks to install Windows Vista SP1 at the exit of the State of the box. Now, Windows update does not work, won't ins
-
Failure of Windows 10 - STATUS_DEVICE_POWER_FAILURE
I tried and could not be upgraded to windows 10 5 times now and it is really starting to frustrate me because it take hours each time. It keeps failing and return to windows 8.1 due to a defect in the engine of Intel (r) management interface. The err
-
I have a deskjet F4480 printer and'm running OS 10.6 on my Mac. When I got it, almost 2 years ago I couldn't scan button to work. I was only able to analyze by entering in the preview or the HP folder, etc. I called HP at the time and they've come
-
I Rec'vd my bank statement and instead of him being in a 'PDF' File Format it downloaded in CSV Format! I don't have Excel etc. Just Notepad + WORDPAD. It is NOT of course the life or death, I'm just curious if this is something that I can fix it. I