change of axis chart xy programmatically
I would like to know if there is a way to control the name of x and y of the programmatically on a xy chart axis labels. I have a case statement that has 4 different case, and I would like to label the y-axis to change and match case who is chosen. I use Volt, straightened up the volts rms, dBV and dBFS, and I want the y-axis to reflect in which case I do by changing accordingly. The way I want to go about this (if possible) is to remove the title running axis and in each case, I program the correct axis label. (Volts volts, dB to dBFS and so on...)
Thank you
Yes, you can use the property of the XY graph node (YScale.NameLabel.Text and XScale.NameLabel.Text).
Tags: NI Software
Similar Questions
-
ScatterGraph does not manually change the axis to execution interval
I use the ScatterGraph and the WaveFormGraph in VS2010 Winforms application. I have the interaction mode axes set to EditRange. The WaveFormGraph command allows to edit the axis range by clicking on the end of the axis labels and modify them. ScatterGraph control is not even though the documentation I've read says it should. The mode of the axis does not seem be the question that I have changed between fixed and AutoScaleLoose (which is not the choice to have everything showing changing data, if you want your range entered manually to maintain). I tried a new project with a ScatterGraph control with the default settings and checked that it does not change the axis interval. Is there a way to change the settings to allow you to manually edit a ScatterGraph range in this way when running?
Thank you!
Hi Lybro,
You have activated the "EditRange" of the graphical object of point clouds InteractionMode? There are two places that the mode of interaction is defined, one for the axis and the other for the scatter chart, both must be enabled for writing at work. I just tested this with Measurement Studio 2013 and it works. Let me know if it helps.
Kind regards
Kevin
-
Change the axis label w.r.t. the scale automatically in the waveform graph
Hello
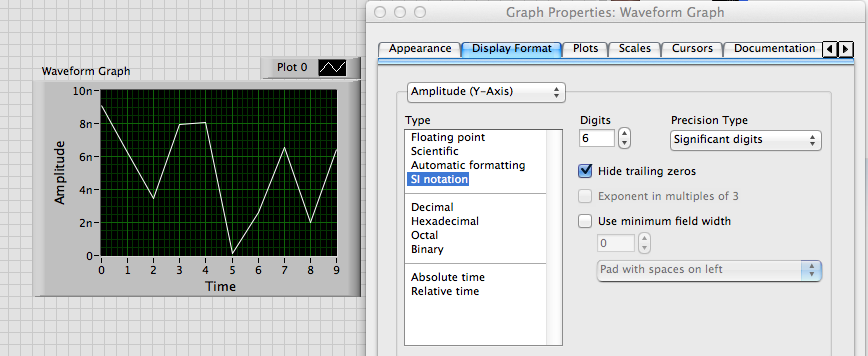
Is it possible to change category axis labels and the value the axis according to the scale automatically? I have a waveform graph which is automatically resized and values on the y-axis of milli, micro and nano volts according to the results of the output from the tests carried out. I need the label of the axis to change automatically according to the scale... Could someone tell me please how to do this. Thanks in advance.
Best regards
Julien
Alain,
I don't know exactly what you want.
If you want to just scale to change as follows: 10n or 5u, use the property format scale IF the Notation.
If you want to change the name of scale label text, you use the YScale.NameLbl.Text property. The attached VI shows one way to do something like that.
Lynn
-
Help! placed grayscale TIFF doesn't let me change his color chart of colors...
Help! placed grayscale TIFF doesn't let me change his color chart of colors...
Tried to revive demand, re-boot PC in the case of a technical problem. Something with graphic blocks that must be re-stored I don't know?
I also tried to create a new page, import another image and persist on the issue.
How do I "re-adjust" my settings so it does not once again?
Thank you!
Here is the information about resetting your Pref.: replace your preferences
But this probably isn't the problem. Are you sure that the images are really grayscale? What format they are stored in? They may not be colorized to identity card if they are transparent or do not have a background layer.
-
Hi guys,.
is it possible to control the display mode of the interactive reports, i.e. display icon, list, view detail, group by, chart, pivot?

As I understand the current setting is stored as a preference of the user for each user... and again when his connection. A settings of the rules them all (all the stored report parameters).
The display mode switchable using a javascript, the api package apex_ir or via a link?
Thank you
~ Dietmar.Hi Dietmar,
It is not a supported way to change the display interactive report mode. With the device connected by Anthony internally, we will consider adding this because part of apex_ir or a link to the future.
Kind regards
Christina
-
AutoScale after Zoom Pan and change the axis interval
I'm trying to connect the axes x many ScatterGraphs and I was wondering how to restore the graphics to their original point of view drawn once a user has made a lot of zoom, pan and axis range chages. Basically how do you perform an autoscale on one axis without having to cancel each operation individually. In the old graphic activex controls, there is an AutoScaleNow function that has done this.
Also, how to cancel a change of range that has been achieved through code? If interactively modify you a range, it seems the SHIFT-RIGHT CLICK to cancel the operation. If the event of range change is captured and applied to the other charts, it can not be canceled.
Use ScatterGraph.ResetZoomPan () to cancel all zoom, pan and change of range in a scattergraph operations. This will cancel the range changes made in the UI, but not changes made through code. To changes in the code, you will have to manage undo operations. You can store the original lines and go back to those who, when necessary. Or you can force a re-AutoScale by changing the mode of scale axis as shown below:
scatterGraph1.XAxes [0]. Mode = NationalInstruments.UI.AxisMode.Fixed;

scatterGraph1.XAxes [0]. Mode = NationalInstruments.UI.AxisMode.AutoScaleLoose;

scatterGraph1.YAxes [0]. Mode = NationalInstruments.UI.AxisMode.Fixed;

scatterGraph1.YAxes [0]. Mode = NationalInstruments.UI.AxisMode.AutoScaleLoose; -
find the distance between two major axis chart point cloud
Hello
I have a scatter chart. Its the y-axis AutoScale property is set to false. The major and minor axes are by default. Interval is set by default.
When draw the graph divisions displayed on the axis are defined according to the range provided. Sometimes, the interval between the major divisions, that is exactly what is defined in the Interval property and sometimes this isn't the same thing. As mentioned in the help the AutoScale property is set to true, sometimes by himself in order to avoid the congested labels.
What I find is the distance beween two major axes of the value axis, as the interval is not the same as set in the property.
Kindly let me know how to calculate the interval.
Kind regards
Nihad.
yAxis1.AutoSpacingMajorInterval
Replace yAxis1 by what is called your axis y on the scatter graph. If you don't know what it is, right click on the axis are the scatter graph, and then select Edit YAxes. Then a box will appear and you can see how it's called in the members section.
-
Hello
Is it possible to change the labels of the axis on the length? Because we designed a graphic page where the SQL statements can be created dynamically. So the axis labels must also be changed. But I couldn't figure out how to make...
Thank you
Osman...Hello
You can create hidden item dynamically set you the value.
Then use point as below on the attributes of table settings Axes&Px_MY_ITEM.Hope this helps and is what you are looking for
BR, Jari
-
That's what I'm trying to achieve;
1. as the user makes a left click near a Summit (of a graph) (within a radius of 50 pixels), the Summit is selected and a small red cross is to see the position of the top.
2. If there are several peaks near the point clicked by the user, the nearest vertex of the click point is selected.
3. as the user is updating a selected vertex, the graphic display is changed accordingly.
Thanks for your help and your time!
Have a nice day!
Cory K wrote:
-
Cinema 4 d Lite modification - axis will not twist after change of axis
Hello everyone, (Total noob here...)
I have a problem with the axis on Cinema 4 d LITE that comes with After Effects cc 2015.
I did a book in C4D lite, I try to cover animation
However, when I try to use the rotation using, it turns in the middle.
I did modified to move the axis to the left side, but then the rotation does not at all. Nothing happens after
I move the axis point to the left. I tried to add an object, null, but that did not help either. Please I need this before Sunday...
 Thanks in advance...
Depending on your screenshot, you are always editing of axis mode. Simply it turn off.
Mylenium
-
Bug? Can change the color chart with the arrow keys?
I used the option live paint and live paint bucket. It's really handy change shade that I use by using the left and right arrow keys to change my swatch in the Swatch Palette. But in CS6, if I do, and the next shade chosen is a percentage of shade of another color (for example, I have a shade of blue and a shade of blue 85%, which is the tinited Swatch blue to 85% in the color palette and then transformed to a saved shade), the 'selection' around the shade box disappears and I can change is no longer the choice of grade without clicking above.
I can switch easily between shades that are not percentages of the original, without any problem. CS5 and all earlier versions that had this feature had no problem whatsoever.
Huh?
The fixed.
Removed preference files. Works fine now.
Mac HD > users > Home > library > Preferences > Adobe Illustrator CS6 settings > en_US > Adobe Illustrator Prefs
-
Change zoom on a chart programmatically?
I'm looking to add a few buttons or hotkeys to a chart control that allows you to zoom in or out a specific amount, or would zoom to adjust horizontally or vertically, but I can't find a way to change the zoom on a graph by programming (in LabWindows/CVI 9.0) - only features zoom/attributes I find are on-AutoScaling and other. Anyone know what kind of features, I would use if I wanted to change the current view on a chart control programmatically?
Hello
you will get a zoom setting the mode of scaling to the manual. For example,.
SetAxisScalingMode (panels, PANEL_GRAPH, VAL_BOTTOM_XAXIS, VAL_MANUAL, zoom_x_min, zoom_x_max);
adjust the x axis to the range given by zoom_x_min and zoom_x_max. It is the same for the vertical axis.
-
Can I change by graphical programming axis Label strings?
I use a chart control that has a Y axis with 8 equal divisions and axis label strings to each division. I always want to 8 divisions equal with the channels of the label to these divisions, however, the maximum on the graph may change (for example: 0, 10, 20, 30, 40, 50, 60, 70, 80 vs 0, 20, 40, 60, 80, 100, 120, 140, 160). I can easily set it up through the GUI editor. I can then allow the strings to Label and set the strings correspond to the values of my 8 divisions.
However, if the maximum axis value is edited by the user (for example, 80 to 160), is it possible to programattically changes the values that when the Label string axis? Is pretty simple change it the maximum axial, but this only me half the way there happens.
Thanks in advance!
Oh, and I am currently using v8.1 CVI.
This isn't a simple question!
Firstly, do you intend to do if the user enters, saying, 125 as the maximum axial value? What of your divisions? And how do prevent you the user to change the minimum value as well?
On the other hand, I remember, is not a special event that is triggered when the user changes the axis interval.
I suggest putting a separate button on the control panel to change the scale, have the use of the maximum desired value with PromptPopup or another method of entry, adapt it to a reasonable value and apply it at the graphic level, leaving the grpah to calculate the value of his 8 Division itself.
That being said, consider that the chart axis labels can be set programmatically using the label strings: see here, section "strings of the axis; the same can be set at design time in the Publisher of the IUR. This can be an option if you decide to go in a different way from the one I proposed.
-
How can I change the address Modbus to Modbus IO server programmatically?
Hi experts,
I use a cRIO 9076 that is configured as a server IO slave Modbus to Modbus TCP communication. I have always used the same Modbus address to configure the server of e/s and it has never been necessary to change so far. So I was wondering if there is a way to change address Modbus IO server programmatically, after it has been initially configured?
Thank you
Volker
Hi Volker,
There is an Express VI, that lets you create or change existing servers of e/s Modbus programmatically createand configure the Server IO. Once you set up like Modbus, you will be able to provide the address programmatically.
In regards to the address - you are right in that the Modbus address configured in the configuration of the server is not really used with Modbus Ethernet. According to Modbus specifications, the address is used when a network connecting Modbus Ethernet to a secondary network series Modbus via a bridge or a bridge. The specs say that the address 0xFF should be used on an Ethernet network. For more information on this topic, Please see page 23.
Hope that helps!
Best regards
-
Can I change or - rt.ini programmatically?
Hi, this is Lee.
I want to change my IP real-time programmatically target, so I edit nor - rt.ini and restart the computer.
Looks good works... but I don't know it is 'really' works well.
Look at the attachment... If I change my IPAddress using the ini file change VI, then nor - rt.ini messed up file. I mean, if I look at the file with Word pad, it looks good, but if I look at the file with note pad it is mess.
And also, there is Mark quatation added.
My question is can I edit nor - rt.ini with ini edit VI? It seems that change the full content, but still works fine?
You must add information about the functions that you use for editing the file.
The strange symbols in the notebook are the 'new line' characters, which of course are not displayed correctly in Notepad. What happens if you open the file changed with the word/wordpad? It seems too strange?
Norbert


Maybe you are looking for
-
I installed the mode full screen add on and I want to stop using the new Firefox uninstall ideally so please be detailed as possible thank you
-
Satellite P855 - 10G and 3D issue
Someone at - it sort 3D yet? Photos from the Nvidia site work fine. Samples of Tosh refuse to display other than side by side.Bought cheap BD 3D "Universe" as a test and he has sturred a few times but now will not play. Really this desire for BIM (Bu
-
Transfer of data to very slow HD (pictures) post on Middle iMac 2010
Why is the transfer of data from my library of Photos so slow? My library iTunes (39 GB) transferred in 30 minutes. The system tells me that it will take 2 days to transfer my photo library. I have 109 GB in the Photo section, when I look to the t
-
Adobe flash player "required update" come into conflict with windows updates?
I've seen a lot of questions about the video choppy, slow stop cause buffering and go streaming video and people with adobe installation issues during their previous version was working fine before the last group of defender, family net 3.5 and other
-
Activation XP