Diagram of frequency domain
Hello world
I'm sorry if the question may seem stupid, but how can I draw the sinusoidal frequencies on the x-axis and the corresponding amplitude on the y-axis after that I could achieve fourier transformation?
Thank you very much in advance for any advice.
Andrea
Use a graph of a waveform.
I'm assuming that your FFT gave you a data table, a F0 and a dF.
Tags: NI Software
Similar Questions
-
Acceleration in the frequency domain
Hello
I enclose a vi that I already modified the existing example. I will use this vi to measure pressures (pressure sensor) and acceleration (from an IEPE accelerometer). Each of the two sensors is connected to a housed in a chassis CompactDAQ C Series module connector 4. The pressure sensor measures the pressure of the water flowing in a pipe while the accelerometer will simultaneously measure the vibration of this pipeline caused by the fluctuation of water pressure. In this vi, I am connecting a signal of pressure and acceleration TDMS file and then read the two signals on the cards of distinct waveform. The acceleration signal is written and read in the time domain. I need your help to make change more on this vi to take the acceleration signal and read on a separate table in the field frequency and written also the frequency of the field values in a file of PDM. After this change, the vi is supposed to have three graphics of waveform (pressure, acceleration time-domain and acceleration in the frequency domain and opens two tdms files, one for pressure and acceleration in the time domain and one for acceleration in frequency domain.)
I tried many ways all failed because I'm not very familiar with the measurements of vibrations.
I thank in advance.
Hello
It is important that you should decide if the frequency data you are interested in are constants based on time, or if you need to know how the data of frequency changes over time.
For constant frequency over time, take a look at the Fast Fourier Transform: http://www.ni.com/white-paper/4541/en/
If you need to know how the frequency display, take a look at the analysis of the frequency of the common time: http://www.ni.com/white-paper/3548/en/
-
Filter of time domain frequency domain filter
Hello
I am applying the weighting filtering of an audio signal.
I'm to draw the response of the filter in the frequency domain.
How can I turn this into a time domain filter and use it with a real audio signal?
In theory, it's pretty simple. You take the s-domain transfer function and apply the bilinear transform. After a few edits, you can extract the coefficients 'food for animals-descendant' as well as the coefficients "feed-forward". These coefficients can serve as input of the filter of Labview functions. As I said, the theory is simple, but I think it will be a tough job to do this. Weighting is used in the measurements of the sound level, to mimic the curve of the human ear. If you plan to use spectral analysis in your application, you can skip the filter and apply your formula for your spectrum frequency bins. In this way, you can save a lot of work, because you stay all the time in the frequency domain.
-
Frequency domain scaling graphic of waveform
Hello world
-I m buying a random voltage signal using a sampling rate of 200 kech. / s on my device NOR and trace the signal acquired on a waveform graph (Figure 1-a). After tasting the random voltage signal my Labview VI also calculates the PSD (power spectral density) of the random signal acquired and it is plotted on a waveform graph (Figure 1B). As the sampling frequency used was set at 200 kech. / s, the maximum value on the x-axis of the curve of PSD´s waveform should be 100 kHz (Shannon´s theorem). When Labview trace PSD´s waveform graph, the maximum value appears as 1. Is it possible to scale the chart of PSD´s waveform in order to define the maximum value on the x-axis as 100 kHz?
Thank you in advance,
Best regards!
Of course, your numbers of the scale correctly and use a property of the range axis node x (your pdf says absolutely nothing about your program or your problem with it. Code would at least tell us something.)
Cameron
-
How to detect the peak frequencies in the frequency domain?
Hello
I built a small test consisting of two sine waves of varying frequencies, program it is and subsequently FFT is performed on it to find the frequencies of two peaks. I tried to display the values of these two frequencies somehow, but I can't find a way.
I searched the forum before asking the question, many of them suggested using extract more Information VI tone I tried and could not get any results.
I have attached to my account. Please take a look. If you know all the discussions on the forum directly related to my problem, please just cite it.
Thank you
LD
Don't wire the tone of several extracts the wire coming from the Express VI of Sprectral. You need to run on the thread after that the two signals are summed.
-
How ro provide Convolution in the frequency domain
Hello world
I have a problem with application a convolution of the image and kernel smoothing in LabView. The idea behind this is that convolution is a multiplication by the area of the Fourier transform. So firstly I want to apply convolution by standart IMAQ convoluted VI, then, to do essentially the same thing, but do it manually FFT of the image and the kernel and then their multiplication by then apply inverse fourier transform and observe the resulting image. Finally, I get two different results, but they should be the same, I can't get the idea why.
-
I would like to turn my non-stationary ground penetration radar and the seismic signals from the time domain to the frequency-wave number domain in my LabVIEW 7.1. The goal is that later f-k/Stolt migration. But I have found no useful VI in LabVIEW. Y at - it all?
Thank you.
Wallace
Greetings Wallace.
Unfortunately, to my knowledge there is no integrated inherent method of LabVIEW to perform this operation. While we have another screw for the conversion of area, such as the field of simple time in the frequency domain, etc., this seems to be outside the scope of what the development system and tool boxes offer at present. If you think it would be a good feature to include in LabVIEW, please feel free to create a product suggestion to www.ni.com/ideas.
Kind regards
Michael G
-
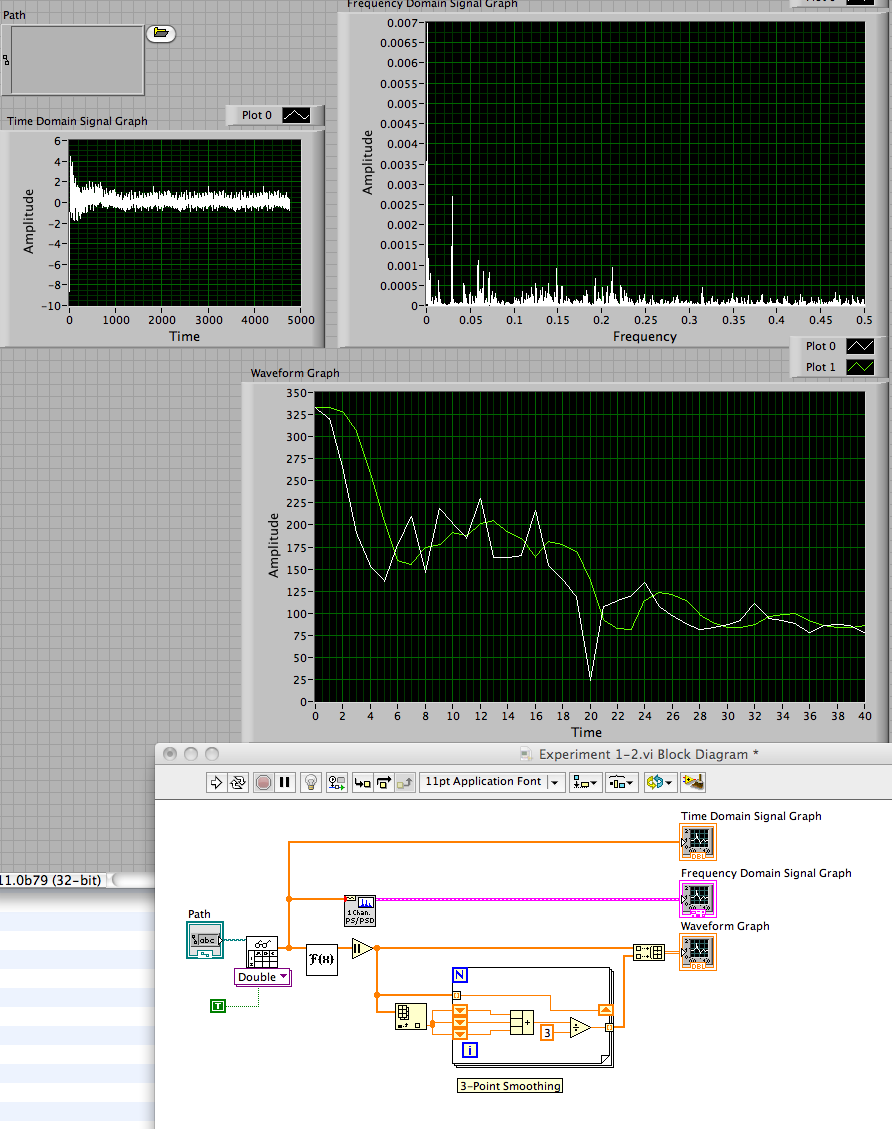
How to reduce the noise/smooth and frequency diagram
Hello! I have a text file that contains a signal. I had read in a format of waveforms and trace the signal in the time domain. I then put the waveform to the PSD vi so graph of the waveform in the frequency domain. This chart has a lot of noise in it so I want to have a smoother graph.
One possible way to smooth out the graph is to take the average of a few points each time interval and graphic news values. So I took the time signal and divide it into tables (time) x and y (amplitude). Then, I took the Fourier amplitude and took of the absolute value of it.
From there, I'm trying to create a design where I would have the average of the values of fourier transform taken every 3 points and then add these points in a table. I would then draw this new table, spaced between 0 and the end point of the original frequency graph, which has a more smooth.
My drawing went horribly wrong, however. The graph resulting goes crazy while drawing a straight line, and I'm also not sure how to have the points evenly spaced to the end point of the graph original frequency. So I have attached my vi and my signal text file and I was wondering if someone could help me solve this problem. Thank you!
Yes, he was wrong. You create a series of paintings to increase the length and the value of constant. A filter for smoothing of 3 points is easy to implement with a shift register. See the image below.
Lynn
-
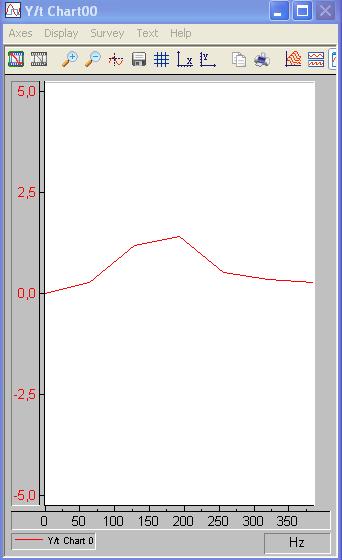
Hello
Before all sorry for my English, I'll try to do my best.
I'm analyzing a data acquired with a FFT, but I want to refine or reduce the frequency of each 'window' (I only want to analyze the 0-350 Hz region)
in order to see better where my maximum in the frequency domain is.
If you have an idea where I can edit this wide frequency in order to refine the plot, please tell me!
Thank you very much!
The sample rate determines the scope of the FFT calculation.
Using the Nyquist theorem, if you sample a 1000 samples per second, the FFT will calculate the range 1000/2 = 500 samples per second.
You NEED to taste at least twice the highest expected frequency in order to use the FFT module to find this frequency.
The resolution of the FFT module is determined by the size of the block. For the spectrum of amplitude by default, TFF will display a block which is also 1/2 on the incoming block. Size of block = 512, FFT block size is 256.
You can increase the resolution by increasing the size of the block and also by changing the size of the block to a number which can divide the sampling frequency. For example, if the
sampling frequency is 1000 and the block size is 500, the FFT output will have a resolution of 250 on a beach of 500.
You can use the data window module to change the block size - increase it to use more data and to increase the resolution of the calculation of TFF. Decrease that it resembles an interval of time smaller and lower resolution of FFT.
I hope this helps.
-
I'm trying to identify the frequency of the sine wave signal and convert it in full. Is it easier to measure in the time domain or frequency domain? According to what is easier, should what modules and functions I use? Another engineer and I was able to go around and around to try different approaches, but just cannot find a working solution. Any help you can give is appreciated.
Bill
Bill,
I see two ways:
For higher frequency sine waves - use module of the FFT. Then the module of statistical values in mode 'Position Max' retrieves the frequency of the amplitude higher in the range.
For low-frequency sine waves, especially those where the full waveform is not in a single block, so you want to try the Pulse analysis Module. To do this, you must change the sine wave to a pulse, using the trigger module. This assumes a pure sinusoidal signal and it becomes a trigger pulse when the value rises above 0. In the simulation, this works well. I don't know how it will work with real data.
I have attached an example illustrating the techniques and results for each frequency of waveform using FFT and analysis Pulse.
-
Questions about the frequency step response
Hello
I use the Signal Express 3.0. I'm not clear on the transfer functions in step of frequency response with different modes of calculation of the average. What I got from the help file is this H (f) = Sab (f) /Saa (f) which is cross the frequencies on the spectrum auto where is the pulse and b the signal response signal. When the mean quadratic value is used, I wonder if the transfer function becomes greatness of cross spectrum divided by the magnitude of the spectrum of the car. When an average of vector is, everthing is used in complex numbers. He averaged temporal signals, frequency domain signals, or the results of transfer functions?
Thank you very much.
The algorithm to calculate the spectrum is the same in both modes. However, the method of calculation of the average can have a huge impact on the outcome. Mean quadratic value is performed on the spectrum itself, after the calculation. Vector averaging is done on the input signals before the calculation. With an average of vector signals must be consistent (have the same phase) or the result will be bad due to the signal being on average by far.
-
I'm new to Labview. I need to plot the data (2 passes, one's time, x table, the other is the intensity of the signal, y table) provided by my instructor in the time domain, which I already did. Then I need to convert the data in the frequency domain. What should I do? I tried the FFT function for my table of y. But how do I know the frequency of informaiton? Of table x, I know it's sampling rate is of 2500 Hz. T = 40, N = 100, 000. the effective maxmium frequency should be 1250Hz, right?
And I also need to isolate the signal of 1000 Hz... I'm totally confused.
Hope you can help me. Thanks in advance.
John
Norbert made some good points - you must have a game and maybe get a good book on the signal processing (not specific to LabVIEW).
You're talking about the 'effective' frequency is I guess that the Nyquist frequency = sample rate/2. If that's what you hear, you don't have what about TI-just be aware that the maximum frequency that will show your power spectrum is sample rate/2.
You can isolate a specific time, the field in the way you mention, FFT signal-> zero spectral bins, you're not interested by-> inverse FFT, (not use FFT power spectrum for this). A standard FFT will put on a spectrum double sided, which is symmetrical to the time series that contain no complex numbers, so you will need to virgins at a given location on both sides of the spectrum - which is perhaps what you were talking about RE: effective frequency. Use everything (not only + ve half) to restore the original signal.
The method "virgins a bin and inverse FFT ' is not a 'good' way to get time series in a band for the treatment of the real signal for reasons I won't explain here. You use usually just a filter on time series, including LabVIEW provides several.
-
Best filter to use for specific frequencies
Hi all
Objective: I am building a program that will give me only the spectrum in the band octave of a waveform.
I tried using a filter of butterworth on a waveform using a bandpass stuck between 22 kHz and 44 kHz FREQ. I am able to get it, but the problem is, if I look at the entire signal octave analysis, I still get data band of 16 kHz, which I don't. I tried to use two butterworth filter in the series, but I can't seem to remove the 16 kHz band.
Band 31KHz level is 120dB, and in 16 kHz band 108 dB. Is there anyway I can get the 16 kHz band down to 90dB, it would be great. I tried to play with two or three other filters, but I can't seem to find a good one or any other way to get what I need.
One thing also, at - it someone knows any tweeters who will be able to produce the band frequency 31khz at least 110 dB or more. I have no luck trying to find one that will produce this high frequency noise.
Best regards
Nitin
Nitin,
If you want to send 22 kHz and mitigate 16 kHz about compared to the 22 kHz 18 DB, you will need a higher order filter. I have not my filter manual is close, but a quick check of the book I available suggests that you can need one-eighth to the tenth order filter. Your standard bandwidth is approximately 1.4. At the point a 7th order Butterworth filter attenuates unwanted about signal 12 dB more than the desired signal.
An elliptical filter or a filter can be useful if you have a single interfering signal to a known frequency. If you have wide signals band, such as noise or vibration, you will need a higher order filter.
You can also be abel use processing techniques and work in the frequency domain, but there is no magic trick to isolate two signals near in frequency and far in amplitude.
Lynn
-
Error to find the frequency of signal to tachometer
I use the vi "Extract only your Information" to find the speed of a motor. The entrance is a monarch Laser Tach AC output. Tach reading is very regular and the AC output is 5 volts peak. There are a few negative pics, but these are at the speed of the engine. My output frequency, who should read the changes back from 1800 1800 at a frequency near 5400, but not exactly 5400 (5321, etc.). Y does it have no signal conditioning that I'm missing before signal to the vi "extract", for example, the window it and then use the frequency domain cutting-edge research?
Thanks in advance,
Ron
Matt,
Just to let you know that I put a bandpass filter in my vi. I took the input of the speed estimated of the user and put in parentheses of the bandpass filter to be 25% below 25% above the target and the input of speed tachometer works very well!
Ron
-
I read a sine wave using a data acquisition with a sampling frequency of 250 Hz. Once I acquire the signal, I get the component signal Y and multiply it by a factor inside a matlab script. I use the wave build function to retrieve the waeform and display it. If I put the component dt of my function to build in 0.01 waveform, this means that the signal is sampled at 100 Hz?
navinavi wrote:
If I put the component dt of my function to build in 0.01 waveform, this means that the signal is sampled at 100 Hz?
Not exactly. You are just lying to the display, which gives it something which has been sampled at 250 Hz and claiming that it was sampled at 100 Hz. If you filter on it or whatever it is in the frequency domain, everything will be far away.
Maybe you are looking for
-
I have an iPhone 6 s, IOS 9.3.2. I can't open the hyperlinks in an e-mail message if I am not connected to wifi. I get the following message: Safari cannot open the page because your iPhone is not connected to the internet. Shouldn't he automatic
-
iPhone 5 s screen is black, not able to see anything on the screen
I was on my facebook app when all of a sudden my screen froze, I tried to close my phone, but now the power button has nothing. Then I blocked my phone instead. Now, when I hit the House or power button, nothing happens. I had a friend call me and I
-
HP Pavilion G6 (1207sg): change the CPU will also apply its iGPU in the system?
Hello I have a laptop HP G6 and want to upgrade his CPU (i3 - 2330 m with HD 3000 iGPU) in an i3 - 3110 m with HD 4000. I did check the socket (rPGA988B) and it doesn't seem to be compatible. This change will also properly implant the new iGPU, or ar
-
a vi uninvasive data retrieval
I am trying to extract as much information as possible to a vi (I'll call him vi target) without tempering with the vi target. So far, I found a few methods to do this... we use a reference to 'open vi' then an invoke node "all the ctrl.val:get" and
-
I'm not able to change the screen resolution it is stuck on 640 x 480
I am not able to change the resolution of the screen that he is stuck on 640 x 480, that the slider will not slip and the color is stuck on 16-bitIt's the 32 bit version of vista home premimum I have a 19 in monitor and resolution needs to be changed