Draw the rectangle on the bottom of the label
Please helep add me pictures on bottom of the label (size of scree resizable image)
I could add pictures but can't make it resizable and can't make it in the background ((())
Bitmap imageBitmap = Bitmap.getBitmapResource ("rectangle.png");
BitmapField bitmapField = new BitmapField (imageBitmap, BitmapField.FIELD_HCENTER);
Add (bitmapField);
see this
Tags: BlackBerry Developers
Similar Questions
-
Draw the rectangle to the intensity chart (position where clicked)
I am able to extract the coordinates using the mouse down and mouse to the top of the structure of the event, but unable to draw the rectangle at the specified position. I get the coordinates to the mouse down and mouse up to the event within these limits. I want to draw a rectangle in the position coordinates, but unable to do so.
One last thing, since you use the Rectangle to draw, you need to deal with cases where the rectangle is not drawn from top left to bottom right. Please make sure that the minimum value X goes to the entrance on the LEFT and the minimum value of go at the TOP of the terminal of the vi entrance Rectangle rect. Use the Max & Min function from the palette of comparison for that.
Ben64
-
Third-party tool to draw the rectangle on the block diagram
I know he was once a third party tool that allowed me to draw a rectangle of Nice double border on the block diagram. Yes, it's the not the front panel block diagram. It was very useful to make annotations and designating functional groups. Does anyone know what this could be? I installed Package VI Manager and went through everything I can think of without finding her.
Unfortunately, the documentation for those modules potentially very useful is poor. The 'Get info' is terse point of unnecessary and by clicking on "Product Home Page" rarely gets you more than a logo, not informative. Surely there should be more details somewhere.
I don't know what you're referring to the tool. What is this logo? Maybe someone can recognize.
What is the problem with the flat frame?
-
Why drag the magnifying glass to draw a rectangle in Illustrator CC 2015 no longer works?
I'm used to be able to draw a rectangle using the class Magnifier to zoom in on a specific area. This doesn't seem to work more after I upgraded to Illustrator CC 2015. Does anyone have an answer as to why? Thank you.
You will need to disable the Zoom in the preferences of GPU.
-
If I use the rectangle tool to draw a rectangle empty, how can I set the width of the rectangle border?
Use: the rectangle tool > the rectangle in the toolbar:

and in the Style box empty

I can draw a rectangle of thin edge, but I want to make the border thicker. How can I do this?
I am running PS version 9.0, CS2
Hello
It depends on how you use the Rectangle tool. You can set it in the options bar.
If you create a form, you must change the size in the field "Stroke" of the layer Style.
If you do just a path, choose a desired brush size and then stroking the path.
If you want to use the layer style (double click to the right of the name of the layer in the layers panel) and use the option of the race. You can even set layer styles to apply to objects with a single click. If you frequently need the thick rectangle, it will be a click.
Layer style presets that are predefined values and cannot be changed on the fly just like real styles, but they are still very useful.
~ jitendra
-
where can I find the chassis for the import file in MAX to draw the circuit diagram before you buy
where can I find the chassis for the import file in MAX to draw the circuit diagram before you buy
chassis: NI SMU-1078
ini file to import into MAX
See attachment
THX
Hi again Koen,
Unfortunately, you can't simulate a complete PXI system, so we do not have the ability to simulate a PXI controller unit. The simulation, you can do is to set up the cards you want to use in you.
concerning
Lars -
The best way to draw the difference of phase vs. time of two signals
I have three channels (time, force, displacement) of approximately 1 000 seconds of a sinusoidal test load test data (sampling rate was 100 Hz). I would draw the difference in phase between the force and displacement (perhaps using a second window 30) according to time. I tried using a few different analysis functions, but I get what looks like random noise (phase difference between force and displacement is very small and the difference in amplitude is very fantastic - 4 orders of magnitude). Any suggestion would be appreciated! -Jim
Hi Jim,.
The phase channel resulting, that you get with the function FFT DIAdem is in the frequency domain. If you select a channel data and time in the FFT dialog box, you will get a frequency channel that results as well as the Phase channel resulting. If you select only a weather channel of waveform data in the FFT dialog box, you will get a Phase of waveform frequency channel resulting.
Brad Turpin
Tiara Product Support Engineer
National Instruments
-
Is it possible to draw the same color for each curve automatically
Hello
Is it possible to draw the same color for each curve automatically. I use graphic XY basis with data set.
Lol you'll either need to set the properties through the dialog box. Or use the nodes property of the graph to adjust the Active plot and then set the color of the plot. This can be done in a loop For.

-
How to draw the lines automatically
In LabVIEW I must draw a line automatically (both vertically and horizontally) the user will define the vertical and horizontal number lines.
Is this possible with LabVIEW
 Thanks in advance
You move to the point of departure of the line using "move the pen", and then draw the line using "draw the line".
Repeat for each line. (using for example a for loop and autoindexing on positions).
-
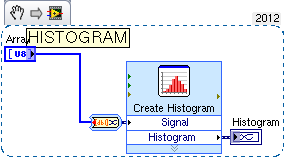
draw the histogram of the random generator of > > >
Hello
I have a bulit a random generator by using + 1 D Cellular Autómata LFSR
I need to draw the histogram of the system to check the shape of the distribution
I have the vision of labview
help me draw
I thank you in advace
concerning
Mathematics-> probability and statistics, below a histogram express vi that will help you.
-
Draw the outline of the particles found by ParticleReport
I use Vision Module 2009 for .NET and c#
My question is how can I draw the outline of a particle found by the ParticleReport(). I tried GetPointsOnContour() but it does not offer the full outline.
In addition, I want to use this particle as a KING for any use.
Thanks for your help.
The same problem is discussed here for LabVIEW:
http://forums.NI.com/NI/board/message?board.ID=200&message.ID=14826#M14826
However, you are using. Fortunately, the same concepts will still apply. Instead of the LabVIEW VI "IMAQ MaskToROI", you must use the MaskToRegions method.
Kevin C.
National Instruments -
Draw the last set of data (1000 samples) in a loop
Hi, I read a waveform data continuously, but I would capture and draw the last data set after my stop. As shown in the picture of attacehd, when the condition is true I acquire data. The number of samples per read is 1000, and as you can see I used a shift register to store data. What I'd like to see where the loop stops is the last 1000 samples but when I acquire real-time data I get a random sample number when the loop stops. sometimes 90 samples, sometimes 950 samples etc... could you please let me know how can I get the last 1000 samples acquired in this loop
I even used DAQmx buffer for data but I can not get the last 1000 samples
Thank you
If your task has a number of points to buy, I don't see how you could have a number UN predictable and random points in the buffer. The task should stop after having acquired the points of "N" and then say it's done.
What do you mean by "stop tripping? You only have a 'start' trigger and it is not available for points once the task has been involved. If you want the last 1000 points of the points "samples per channel", the last reading should return those. I've never used the property "Done" before. Count your samples read instead and stop once you have what you wanted.
-
How can I draw the intensity in real time of a picture in time real (imaq 1394)?
I have a firewire camera.
I hooked up my camera to my pc with labview and now I display image in real time. How can I draw the intensity of a region dependent on time?
Y - intensity
X - time... I would watch the variaions real-time intensity...Thanks in advance
The light meter example is pretty much what you want to do. It is located here:
\National Instruments\ \examples\Vision\2. Functions\Light Meter\Light meter Example.llb\Light meter Example.vi In the example, the x axis are the number of iteration, but it is easy to modify to use a graphic instead of a graph and chart the time instead.
Hope that helps.
Christophe
-
How to draw the graph of output?
Hello
How to draw the graph of an exit? is there any api for it?
The short answer is that there is no API, but you can create your own field if you want to, and here are some samples:
http://supportforums.BlackBerry.com/T5/Java-development/create-graph-fields/Ta-p/444968
I recommend the search before you ask questions to see if other people have asked similar questions. If you type chart in the search box you will find other similar topics.
-
Draw the line below each item ListField
Hi all
I want to make a ListField similair to the contacts application. Under each ListField article a horizontal line is drawn as a separator. Somehow, I can't draw a line under each article. It works if I put the line above each item, but this means that the last element does not.
That's what I'm doing now:
public void drawListRow(ListField listField, Graphics graphics, int index, int y, int width) { // Draw a line separator above each field except the first one if (index != 0) { graphics.setColor(Color.LIGHTGREY); graphics.drawLine(0, y, width, y); }}Thanks in advance
When you draw the line, you need to add the () listField.getRowHeight for the parameter y and subtract 1, IE
graphics.setColor(Color.LIGHTGREY);
int yPos = y + listField.getRowHeight() - 1;
graphics.drawLine(0, yPos, width, yPos);

Maybe you are looking for
-
Satellite A300-15V: keyboard does not work after that Win7 has started
Hello I just installed windows 7 64 bit on my A300-15V and some strange problems: When I boot up, the keyboard and the touchpad works until I log in, as soon as the desktop appears my keyboard and trackpad stopped working.If I restart the laptop ever
-
New need hinges for Satellite Pro A40-251 broken screen
Hello The two hinges on my broken screen and I am struggling to find brand new or 2nd hand to replace them. Can anyone suggest a supplier and some reference numbers please? Thank you very much, George.
-
HP-15R249TU: Windows 7 drivers for HP 15-R249TU
Dear HP support, I am looking for the drivers for my laptop HP-15R249TU the OS of WIndows 7 (32 bit). I did not find the drivers for WIndows 7 OS on the HP website. (I like to use only Windos 7 (32 bit) OS on my laptop HP 15R249TU that he did not hav
-
jQuery Mobile + BB 9780 (V 6.0) affects exhaust and the text entry
Hi all I'm new here and for BB Dev. So I don't know if it's good for me to post the questions here, but I think it's worth a try, at least. I use jQuery Mobile, 1.1.1 to develop an application of BB. At this point, I make the user interfaces and obta
-
In the treatment of the Upload, I have a progress in inventory for 11 days
Hello In the treatment of the Upload, I have a progress in the inventory for 11 days. I think it might be hung. I already have another inventory, but it might stop the others for the last 2 weeks. Thank you Clark Collins IV SWN