How programmatically, click the LINK icon in the first row of the report
HelloI want to programmatically (using jQuery) click on the LINK icon of the first line of a form with report
so that the data on the first line is displayed in the corresponding elements of the table in the form without the
user has to click the link.
Firebug, the link icon is < td = 'LINK' headers >.
Please show me how to use it click on the link.
Thank you
Leckraj
Hi Leckraj,
I added the test to the application.
The test now looks like this
($v("P2_FIRST_TIME") != 1 && $("td[headers='LINK'] a").length > 0)
Kind regards
Kees Vlek
-----
Company: http://www.orcado.nl
Blog: http://www.orcado.nl/blog/blogger/listings/69-kvlek
Twitter: http://www.twitter.com/skier66
If the answer to question please change replied and mark the appropriate post as correct / helpful.
Tags: Database
Similar Questions
-
How to generate the report on rules
How to generate the report on rules with id recipient and with a few keyoword in a rule.
The rule management dashboard has an integrated 'report rules', you can configure properties and input parameters.
For rule management dashboard, click homes > Administration > rules. In the upper right, next to the date and time, click reports.
You can also find these helpful videos: http://edocs.quest.com/foglight/5610/Foglight_Reports_videos.php
Hope this helps,
Shay
-
How to create the report of this style?
Hello
I have a problem when creat a report using obiee, this is a monthly report, the layout like calendar,.
There is a quick baseed on the month, if I choose 201109, the report will be poster of daily sales and the number of customers in September.
Every day have the sale and every day must be listed, first line display name of 7 days, second row shows sales and number of customer information,
third row display name of 7 days, and all the following steps.
1 sep | 2 sep | 3 sep | 4 sep | 5 sep | 6 sep | 7 sep
Sales: sales: 10 sales: 10 sales: 10 sales: 10 sales: 10 sales 10,10
: No.10 No.: No. 10: No. 10: No. 10: No. 10: 10 no: 10
8 sep | 9 sep | 10 sep | 11 sep | 12 sep | 13 sep | 14 sep
Sales: sales: 10 sales: 10 sales: 10 sales: 10 sales: 10 sales 10,10
: No.10 No.: No. 10: No. 10: No. 10: No. 10: 10 no: 10
15 sep | 16 sep | 17 sep | 18 sep | 19 sep | 20 sep | 21 sep
Sales: sales: 10 sales: 10 sales: 10 sales: 10 sales: 10 sales 10,10
: No.10 No.: No. 10: No. 10: No. 10: No. 10: 10 no: 10
22 sep | 23 sep | 24 sep | 25 sep | 26 sep | 27 sep | 28 sep
Sales: sales: 10 sales: 10 sales: 10 sales: 10 sales: 10 sales 10,10
: No.10 No.: No. 10: No. 10: No. 10: No. 10: 10 no: 10
29 sep | 30 sep
Sales: sales 10: 10
No: 10 no: 10
Thank you! waiting for your response.So you're a user same as below:
How to view the report by using the style of calendar in obieeFollow my instructions. Also, give a look at this http://bischool.wordpress.com/2010/10/22/calendar-view-in-obiee-and-applications/
You can have dates instead of the name of the day, but you must ensure that your definition is very clear in your time dimension i.e. each week week 7 days. You table looks like his week to jump and you have each month as 30.31 or 28 days...
Come and play and you're done... hope its helpful
-
How to view the report by using the style of calendar in obiee
Hello
Can someone tell me how to view the report as the calendar?
When I choose chrystelle, it displays 31 days. 7 column, from Sunday to Saturday, and each cell displays the detailed information, such as sales from today!
Thank you!Hello
Please foloww the below blog...
http://bischool.WordPress.com/2010/10/22/calendar-view-in-OBIEE-and-applications/
Thank you
Vincent -
Graph of Mixed Signal: how programmatically change the name of the group in the legend?
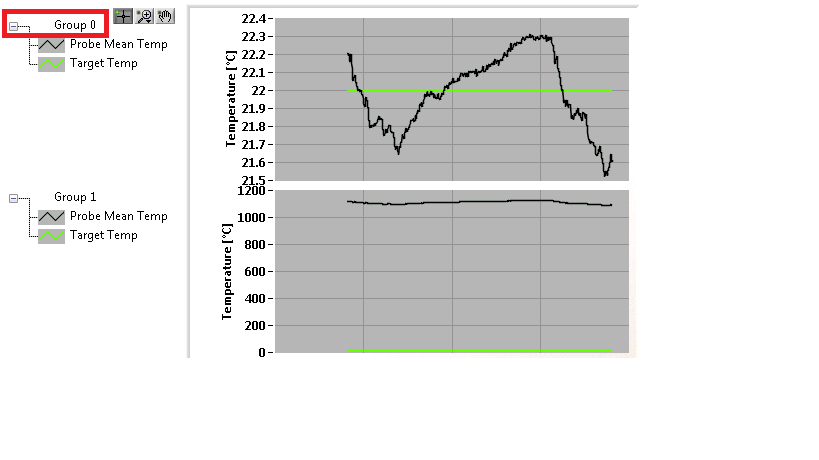
Hello LabVIEW community,
Can someone tell me the property node that would allow me to change the name of 'Group 0' programmatically in the legend below? I have searched through all mixed methods graphic Signal and nodes of property with no luck and should just be overlooking it.
Thanks for your time.
Steve
Hello Electromecha,
Unfortunately, there is not a property node associated with the name "Group" in the legend. Several others have made that suggestion over the years. I recommend kudoing the idea in the IdeaExchange.
-
How to read the report of the unit for HP Deskjet 1510
Hi HP.
I see the software provided with this printer, it has this option to print the reports of the unit.
Please help on how to read this report because it consist of unknown coding and other things.
I would be grateful if your side can help me on this coz I guess we can follow our consumption through this report.
If this isn't the goal, maybe you can suggest another way to get understandable use of reports?
Kind regards
Nadiya
Hello Nadiya,
Welcome to the forums

I understand that you are looking for a usage report. The printer prints a test page and you can see the number of pages on this page, as well as information about the printer, such as serial number, etc.. If there is anything else that can say 'use' it please let me know and I'll do my best to help.
Click on this link: streaks of ink, fixing faded prints and other common print quality problems
In the guide, look under "Solution 6: print and evaluate a page of test and troubleshooting of faults" and print a test page.
Take care
-
How to avoid the report query needs a unique key to identify each line
Hello
How to avoid the error below
The report query needs a unique key to identify each row. The supplied key cannot be used for this query. Please change the report attributes to define a unique key column.
I have master-detail tables but without constraints, when I created a query as dept, emp table he gave me above the error.
Select d.deptno, e.ename
by d, e emp dept
where e.deptno = d.deptno
Thank you and best regards,
Ashish
Hi mickael,.
Work on interactive report?
You must set the column link (in the attributes report) to something other than "link to display single line." You can set it to 'Exclude the column link' or 'target link to Custom.
-
If the field of database increases in size, how to change the report to display this increase?
Hi all
I work with Oracle 10 g of reports and have a report that has already been created. I need to increase the size of a field from 50 to 200 in width to accommodate a change in database. When I click on the field and click Properties, the value of width is locked. How can I change this?
Thank you
Steven
Open your query again.
make a tiny tiny change, maybe add a space, or something between two words. you might even be able to cancel your change (remove the space).
Press OK.
the reports will be realize you changed your table and adjust.
-
How to view the report on one Clob column online?
Hello
In a set of columns in the report created with the wizard to create a Page, a Clob column is made that resembles a dozen lines high. The other elements are the high standard of a line. How can I load Apex to restore the Clob, the same height as the other columns (on one line)? Left like that, I'll only be able to see 2 or 3 lines at once, even if there is very little data in Clob columns.
I would have attached a screenshot, but I do not see this feature on the forum site.
BTW, I guess this is a common newbie question. I don't see an answer in the Forum or in the documentation. Your response is appreciated.
Thank you
KimKim2012 wrote:
Unfortunately, at this stage of my Apex maturity, it would be very difficult for me to reproduce the problem on apex.oracle.com (don't laugh, Jedi are not built in a day).It's very simple.
1. sign up for an account on apex.oracle.com.
2. in your local installation of the APEX, go to SQL Workshop > utilities > generate DDL. Click create a Script and use the wizard to generate a DDL script that contains the objects of database required by your application. (You can find out what they use Application Builder > Application > utilities > database object dependencies.)
3. your local installation of APEX export demand.
4. download and run the DDL file on apex.oracle.com using SQL Workshop > Scripts SQL.
5 import the request to apex.oracle.com.So I resort to ad a page to SkyDrive. When you see the picture, the question will be very clear and I guess that there is a way to dusty solution tucked away in the vault. Note: I would like to limit the height of the text element, not the width of it. Here's the URL for the screenshot.
Go to the Notes column attributes. Define the number of rows to 1 and the attributes of the element to
style="height: 1.3em;"You may need to adjust the height to match other items. (Or according to browser [s], may not need any: in Firefox on Windows 7 14 "number of lines: 1" seems to mean "number of rows: 2". ") (Go figure.)
-
How to change the reporting studio years
Hi guru
I have a folder named 2011 in reports, there are 100 reports in there. All reports pointing to 2010. I need to change all the reports from 2010 to 2012. How to get there?
concerning
SmileeHello
You must go the grid PoV with in the report (right click on the top left part of grid and select grid poV) and change the PoV year in 2012.
Suggestion: You must change the PoV "User view" year in this way, you should not report 100 update each year. Users will select the PoV at the time of the report and that they can run the report for a given year they want.
In this way, you will not require creating all 100 reports for each year.
-
How to publish the report in the desktop xml editor version?
Hello
I am new to Oracle BI Publisher Desktop version. I have the xml file which the extract is given below.
< fsg:RptLine RptCnt = 'p1001"RowCnt ="r100001"LinCnt ="l100205">
< fsg:RptCell ColCnt = "c1000" > 132106 ALLBANK no frills SB ACS 0101 < / fsg:RptCell >
< fsg:RptCell = 'c1001' ColCnt - > 2,690,119,531.67 < / fsg:RptCell >
< fsg:RptCell = 'c1002' ColCnt - > 20,851,258.26 < / fsg:RptCell >
< fsg:RptCell = 'c1003' ColCnt - > 2,710,970,789.93 < / fsg:RptCell >
< / fsg:RptLine >
< fsg:RptLine RptCnt = 'p1001"RowCnt ="r100001"LinCnt ="l100206">
< fsg:RptCell ColCnt "c1000" > 132106 ALLBANK no frills SB ACS 0102 = < / fsg:RptCell >
< fsg:RptCell = 'c1001' ColCnt - > 4,927,721.27 < / fsg:RptCell >
< fsg:RptCell ColCnt = 'c1002"> 67,338.00 < / fsg:RptCell >
< fsg:RptCell = 'c1003' ColCnt - > 4,860,383.27 < / fsg:RptCell >
< / fsg:RptLine >
I have to publish a simple report in the following format (fields separated by pipe):
132106 ALLBANK SB UNADORNED ACS 0101 | -2,690,119,531.67 | -20,851,258.26 | -2,710,970,789.93
132106 ALLBANK SB UNADORNED ACS 0102 | -4,927,721.27 | 67,338.00 | -4,860,383.27
While preparing the rtf file, I'm not able to understand how to insert the value inside say < fsg:RptCell ColCnt 'c1002' = >
tag. Can someone help me with this?
Thank youHello
It is well documented:
http://download.Oracle.com/docs/CD/E12844_01/doc/BIP.1013/e12187/T421739T481157.htm#4535427For your case, all you have to do is:
(1) add the namespace to your XML data:
....
(2) add in the RTF model according to the above link:
(3) to loop through your lines:
Work around this problem:
| ... etcconcerning
Jorge
Published by: Jorge Anicama, March 8, 2011 13:22
Published by: Jorge Anicama, March 8, 2011 13:37
-
How to rename the report server name
Hello
I would like to know how we can rename the report server. We have dev and environment in the same network of prod and it seems that the name of the report server must be unique.
I followed the following link and also changed the $OH\sysman\emd\lastupld.xml file.
How to change the name of report server?
When I try to run the report, it still doesn't seem to work. Then, in the 'Application Server Control', I am unable to see the renamed server name.
Please provide any information.
Thank youPerhaps.
If you talk about the forms Dev tool there are several ways to do so. I could try, it's find and replace SQL inside forms to see if the report server is hardcoded.
Get an example on my end.
-
How to see the report on health v29 firefox?
My firefox works slowly and I wanted to see the report on the health, but I got lost in the new interface of firefox, of course I really like it but right now I'm lost and cannot find how to open firefox report health function.
So can someone point me in the right direction?
Thanks in advance
You can type about: healthreport in the address bar and press ENTER.
Also try to read Firefox is slow - how to make it faster
-
How to change the report batch header text in the report dynamically?
Hello, everyone. Now I use teststand to measure a voltage test point.there value are a PIN in the control circuit of this values.now I want to change the report batch header text in the example of report.for, I use only one step in a sequence file and can use an expression to change the PIN value.now I want to change the header text batch report through the movement of the expression.i is not found of teststand help document.how I do?
Thank you ~.
my email is [email protected].
In addition, I'm sorry to tell you that my English is poor.if you have any questions, just tell me as soon as POSSIBLE.
I'm looking forward to your reply ~ ~ ~
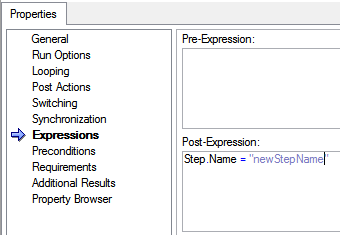
Hi sar818,
This article points to the name of the step, you can modify with the TestStand API:
Step.Name = "newStepName".
You can call it is the expression of position of the step:
Note that this change will only continue during execution.
-
How to use the report generation tool to get a list of bookmarks in a Word template
I'm working on a project where I need to use the report generation tool to fill a fairly long Word template. MS Office report Express VI can have entries for a maximum of 17 bookmarks that is not close enough to what I need to do.
I wonder if there is a way to use the lower level screws report generation to read the word template and return a list of the names of bookmark in the form of a table 1 d of string. The dialog box that allows you to implement the Express VI has this ability, but I'm not finding a way to scan the document programmatically.
I'm sure I can't be the first person to encounter this problem and I hope someone out there has found a good solution.
Found the answer to this one that I was looking for the forums. Apparently, you can do this directly through everything in the VI report tool, but there is a VI in Wordsub.llb do that.
Maybe you are looking for
-
cannot use three finger view Preview
cannot use three finger check to open in the preview pdf
-
Firefox is exhausted before but cannot start more
Firefox is exhausted before but cannot start more.I tried the solutions, but it does not work
-
Satellite L500 series. No recovery menu. no option to restore just C.
LS.The other night, my phone still worked fine. The only systemchange I did installed a program to read djvu files.Now my computer is unbootable. It just says: ------------------------------------Windows does not start. A recent hardware or software
-
Hello I have problem Pro.l Mac I can't connet to projector .this which the problrm
-
my ipod is disabled. I will lose all the photos when I erase
my ipod is disabled. I understand that I need for recovery, but I lost all my photos?