LabVIEW 'Summary' Collecting data points
Hi all
I am currently using LabView for my project of end of studies to the University of Amsterdam. The installation is with LabView, I do a HP 33120 A function generator transmit a Gaussian pulse in a material through the electric Piezo transducers and these sensors also collect the signal. It is then amplified by a physical Accaustics 1220A preamplifier to transfer the signal in an oscilloscope Tektronix DPO2014, which transfers in Labview data points again.
The time of the collection is set to 125000 points, and that is the problem. It used to work perfectly, but now that she sees another 125000 points of data, of which only 3000 points contain the entire signal. The rest is sort of 0. In other words, the usual response of 125,000 points is now summarized in 3000 points.
Do you have an idea what could be the problem? Or the solution?
With sincere friendships.
Matthijs
I've added a PDF file with the explanation of the VI that I use.
Solution is found. Apparently with windows update the drivers of the oscilloscope has changed. So: Problem solved!
Tags: NI Software
Similar Questions
-
Strange behavior when using Labview to collect data from Tektronix oscilloscope tds8200
I hit a wall in trying to understand this one. The problem I have is that my application will not start the oscilloscope when it should.
I use an oscilloscope Tektronix TDS8200. My goal is to collect data from the oscilloscope using Labview waveform. First of all, my program initializes and configures the oscilloscope; This part of the program works very well.
The second part of the program begins the acquisition of data with the function 'Tktds8k Start or Stop Aquisitions.vi', which is to press the button run on the scope. The function "tktds8k to Waveform.vi" is used and should ideally return data, which I connected to a waveform playback graph.
When I run my program, the first part runs without a problem, but as soon as the program comes to the service get the waveform, the run button in the scope, which is green when running, turns off; the program then expires, and no data is collected.
Here is where it gets weird. I went through the debugging to try to understand this point, and I put breakpoints on the beginning and get shape wave functions so that I could scroll through the last part of the program. The program continues with the departure function, and the button run in scope is green. The breakpoint for the function get the waveform is reached and when I press on continue, turns the Run button and turns it off then back on almost immediately. data are collected, the waveform graph appears and the program ends without error.
I thought that the timetable could be the problem, so I did the program wait as long as five seconds between the functions of start and get the waveform and that did not work. I also tried to move the start function to before the configuration functions and remove start completely; no method worked.
is there any ideas on why, the program works when I enabled breakpoints and isn't when breakpoints are disabled? I'm sure there is an easy solution, but I was not able to find a solution.
I have attached a pdf that contains information about the functions of the Oscilloscope (tktds8k.pdf), and I have also attached my program.
-
How to collect data on the programs of LabView and VC ++ at the same time?
Hello
There are two programs in LabVIEW and another is in VC ++. The two programs to collect hardware data.
Therefore, for the experience, it is necessary to begin to collect data at the same time and lag must be
less than millisecond (it is essential for the experience). How can this be achieved? BTW, I'm new to LabView.
I think on the use of network socket to get the message for both applications.
I was wondering if there is a better way.
Thank you.
MARK002-MAB wrote:
Hello
There are two programs in LabVIEW and another is in VC ++. The two programs to collect hardware data.
Therefore, for the experience, it is necessary to begin to collect data at the same time and lag must be
less than millisecond (it is essential for the experience). How can this be achieved? BTW, I'm new to LabView.
I think on the use of network socket to get the message for both applications.
I was wondering if there is a better way.
Thank you.
You do not say if two programs access the same material, but I guess not. Because if they did, you probably get conflicts when the two programs try to access the same material at the same time.
In either case, the only really reliable way to ensure that your needs of< 1ms="" would="" be="" hardware="" triggering.="" one="" hardware="" unit="" is="" programmed="" to="" provide="" a="" hardware="" trigger,="" typically="" a="" digital="" signal="" and="" the="" other="" is="" programmed="" previous="" to="" the="" desired="" start="" point,="" to="" wait="" for="" that="" trigger="" and="" start="" automatically="" when="" it="" is="" received.="" if="" both="" hardware="" units="" are="" ni="" daq="" cards="" you="" can="" do="" that="" fairly="" easily="" using="" the="" rtsi="" bus="" or="" in="" case="" of="" pxi="" the="" pxi="" trigger="" lines.="" if="" they="" are="" different="" hardware="" then="" it="" can="" get="" more="" complicated="" to="">
-
LabVIEW and storage data collection?
for a beginner complete labview, which is the best way to collect data of hardware connected by rs-422 serial port?
-
How can, during the collection of data, start a new column in my table every 100 data points?
Hello! I have a problem with my data - I get in a wide range of 1 x 1000, but it's the repeated measures, each taking about 500 data points. I want to break this table for this data string start a new column in my table every 500 points given. I don't know how to do it-please help!
datacompiler100 wrote:
Hey thanks for the sponsor and the first off I must apologize for the State, I am attaching my VI. I put the part of the VI that I am working on (my team has access, so didn't post everything here) and also attached the data file (when just written in a spreadsheet file, not through the attached VI). I want to convert the long row of data and then start a new column every 50, 100, 5 points (user-defined).
Using the data from the file, you can reshape everything simply (as you already!), followed by transposition (since you want columns instead of rows). 2D arrays must always be rectangular, so the last column is filled with zeros if necessary. Is that what you want?

Of course if you try to add a new column in a file, that will not work. You can only add lines in an existing file because of the way the data is organized. To add columns, the entire file must be read, intertwined and all re-written new data in the file.
-
Sampling rate - too much data points
Hello community,
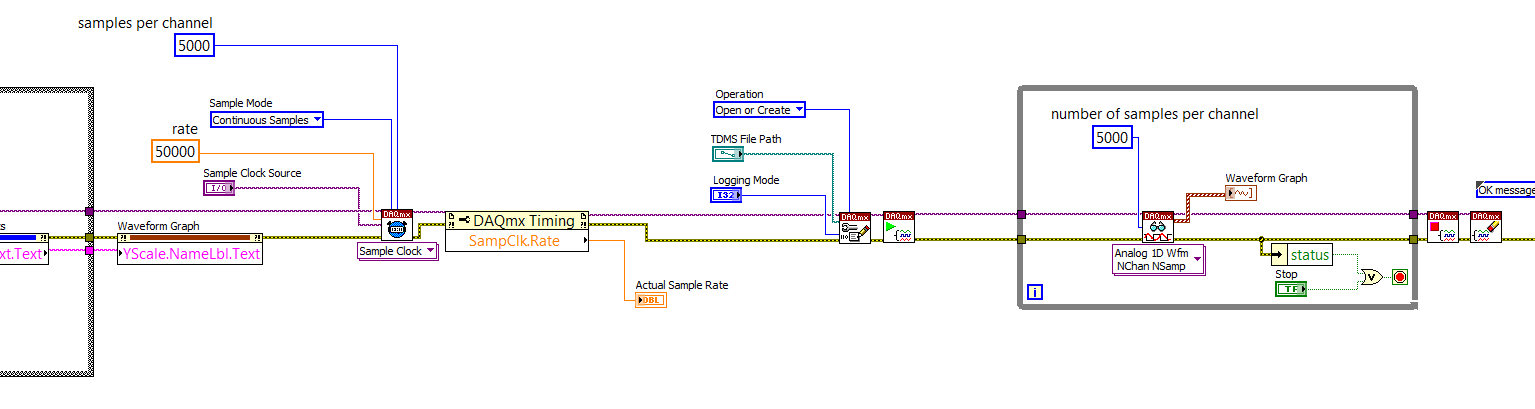
I use a sensor signal strength of pressure on DAQmx labview through 2014. My rate from the hardware synchronization function is 50 KHz. The samples per channel of timing and read screws are the same set to 5 Khz when the channels are a continuous sampling. The problem I'm having is that when I run labview for a few seconds, say 5 seconds, I'm half million points of data. I tried to run for 10 seconds and points were more than a million where it is difficult to analyze. I think that the vi generates too much data points and the buffer is large. Am I wrong? Can you please help me solve this problem?
Kind regards
Mike
You are now ready to learn a little of the power of LabVIEW and data flow programming. LabVIEW is an inherently parallel language - two loops can run independently and in parallel, allowing you to make time-sensitive (such as sampling data) and a lot of time (such as data logging and tracing) at the same time, using queues to pass data between the loops and ensure the buffering required.
If you open LabVIEW and click on the file menu in the toolbar, and then select new... (the points are important!), you will be able to create new ones (VI) from the model. Choose a Framework, Design Patterns, producer/consumer Design Pattern (data). It's what you want to do.
You basically set up a "pure DAQ Acquisition Loop" (without logging TDMS) as producer, creation of 5000-element arrays of data every tenth of a second (if you are sampling at 50 kHz). You create a queue of data outside the loop of producer whose elements are an array of 1 D of waveforms (the output of your Read DAQmx) and instead to send the data to a waveform graph, you put it in the queue.
You are under this loop, a parallel loop that gets the same queue and remove items. This loop will be sitting idle (no time taking CPU) until the data is queued. He then it takes away the poster and registers (logs) in a PDM file. Either way, you should open the TDMS file before entering this loop (consumer), write to the file inside the loop and close the file when the loop exits. Study the example of the VI, you create with the model and see how it works.
The beauty of this is that you can certainly 'keep up' with the writing of the data points in a TDMS file to 50 kHz. You might not be able to display all the points, but there is nothing to prevent you from data processing (by, say, decimating or "block average" it) to a more 'user-friendly' display (your eyes ' sees' a 50 KHz signal?) -you have a set of 100 msec prior to the next package arrives in the queue. Also note that the loop of producer probably takes very little time CPU - most of the time the material is waiting for its clock to 'tick', collection of points in a buffer, then transferring to the loop.
Now you can have your cake and the computer display, too.
Bob Schor
-
recording of data points over 6 million deposit
Hello
I try to save all my data points of tension, plus 6 million points, I've gathered using DAQmx LabView functions in a file. The code I did works very well and will be traced all points on a XY graph, but when I try to export field data in a txt or excel file LabView wants to close. I understood how to use the functions of PTM in the toolkit features LabView and it prevents the program from closing; However, it will return a set of data points, but not all the data points. I was wondering if there is a way to divide the data into small amounts and record into several files. I thought maybe I could get my data points index in different table rows and save each line in a clean file but I don't know how fast the program can create and save new files. Any suggestions? My sampling rate is ~ 412 714 per second over a period of 15 seconds and I collect samples total 6 190 708.
Know / do you understand the concept of stream, Central of LabVIEW? A data flow consequences, is that if you have two loops While not connected in series to each other (i.e. you do not have an output of a session at the entrance to the other), they will both run in parallel, 'sharing' of the CPU. So if a loop is the acquisition of data from a DAQ card, which means that if card is programmed to deliver 1000 points to 1 Khz, that loop basically 'wait for' maybe 998 milliseconds, then switch 2 milliseconds delivering 1,000 points (it's probably even faster than that). So, if a loop requires 2 milliseconds per second, which leaves 998 milliseconds per second of time CPU for the loop to do everything he needs to do.
This is the "magic" behind the producer/consumer model. Both loops are connected to their entries by a queue, so that they can operate in parallel. The producer, when he gets his 1000 points, put simply all points on the line and it's done. Points "travel" in the queue (if you want to think about it this way) on to the consumer, where they are removed ("reconstituted") and then plotted, written to the disk, FFT would or whatever during the "copious free time" remaining after the producer had its aliquot.
Bob Schor
-
move the data points on the waveform display
Hello
No idea why the waveform display to my VI has shift the data points? The third tab of the screen does not display this problem. I took a video of what happens to better illustrate what I'm talking about and attached my VI to identify the problem.
I am currently a sample of data from a DAQmx and storing in a queue until data backup button. Everything works well, but the problem is the display of actual data, which, although sense points, it shows move in a small area around where they are drawn in the first place. It happens even when I erase the visible data and restart the collection of data, as shown in the video.
Thanks for any help you may be able to provide.
Guy
The amount of data you draw? If you draw a lot more datapoints that there are pixels on the x-axis of the graph, you can get peaks that appear to move because of graphic interpolation LabVIEW has to do.
Mike...
-
Hi all
I would like to know where is the location of the mouse position to a point of data compared to the graph. basically, the opposite of this person's job action:
The point value of graphic display WPF overview
Instead of getting a data point, hold the position of the mouse. I am the superposition of the shapes on the chart and would like to know for a specific point in the graph in pixel coordinates.
Thank you.
Of after your question, I assume you have a data value you want to translate (as opposed to an event arguments of mouse, which already has a
GetPositionmethod).You can use the
DataToScreento get a position of the screen in the plot area, so useDesiredPlotAreaMarginto compensate for this position on-screen to reference external graphic control (i.e.point.X += margin.Left; point.Y += margin.Top).You can also use the
DataToRelativeto get a relative position of a data point, then place an object in theChildrencollection (a bit like aPointAnnotation):XAML
xmlns: or = "http://schemas.ni.com/controls/2009/xaml/presentation."

xmlns:niPrimitives = "http://schemas.ni.com/controls/2009/xaml/presentation/primitives".

...


                 Width = "10".

                 Height = "10".

                 STROKE = "Black".

                 StrokeThickness = "2".

                 niPrimitives:RelativePanel.RelativeHorizontalAlignment = "Center"

                 niPrimitives:RelativePanel.RelativeVerticalAlignment = "Center"

                 />
Code
Parent = graphic point. DataToRelative (dataValue);

RelativePanel.SetRelativeHorizontalPosition (dataMarker, relative. (X);

RelativePanel.SetRelativeVerticalPosition (dataMarker, relative. Y);
-
Hi all
When I was in the lab at school, I used labview to collect the raw data and plotted using a Matlab
simple,
However...
here at work, they do not have a Matlab:)
I'm trying to get 5K samples / s and he's not going to be given at least 1 hour... She would go up to a day or more
I thought, excel is unable to process these data (field)
Can I use Labview for this draw after the acquisition?
instead of using a Matlab?
Thanks :))
Hello
Yes, you can use graphic waveform in LabVIEW to plot your data after acquisition. If the data (file size) are no longer, you can plot the data into several segments and use a scroll bar to view all of the data.
-
Need to collect data every hour
Hello
I'm relatively new to labVIEW and need help with this particulare VI. It is configured to collect data of vibration at noon and midnight. What I need to be able to have it changed so I would be able to collect data from every 1 hr. And eventaully I want to collect every 4 hours. Any help would be appreciated.
I would be created something like this:
The seconds time lets get a cluster of the time. We just need the hours, Minutes and seconds of the cluster. For the hours, use the Quotient and remainder divided by what you increment. Add remaining with the seconds and minutes. If the sum is 0, then you can start your recording.

-
Collect data from specific frequency of the power spectrum
Hello
I want to know how to collect data from specific frequency of power spectrum file. I'm trying to separate data from specific frequency of the original file.
This will depend on much how your data is stored. You will need a way to read the file in LabVIEW and then a way to identify the data you want. I often record data in a .csv file, then I use "Reading worksheet" to get the data in a table. Then, you can simply use 'Index Array' to get the datapoints you need.
-
Hello. I am looking for a way to draw several XY cursors, then use a lasso (like paint or photoshop) tool to select a subset of the sliders.
Lasso would allow the user to outline to draw a region with the mouse to select cursors within the lassoed area.
Labview graphics can do this natively? Or maybe someone knows an elegant solution to achieve this?
Hi Marksyn,
No, that behavior is not native in LabVIEW.
First off, the selection can be rectangular, or should it be a "freeform"? The latter will be much more difficult to write, but it could look like this.
Build an event structure and case of mouse event down / mouse upwards (to keep track of when you press the button) and mouse move the XY graph. In the case of mouse move, LabVIEW returns the coordinates of the mouse control panel each time it moves. For the XY coordinates, use a node to invoke the graph with the method "Panel of XY coordinates." Make a list of all the XY coordinates until the mouse button is released. This table is your free form boundary. The tricky part now is to get a list of the "sliders" (or do you mean data points?) included in this limit. Let us know when you make it that far.
-
several data points Boolean indiacator
I run a program (which I'm still trying to work the kinks log data on) where I need to take several different channels and give me a warning if the temperature exceeds a certain limit. I'm 7 channels linking fieldpoint in a picture and sending it to a curve of waveform. I want each of these signals during playback to trigger a Boolean indiactor (LED) if the ambient temperature is more than 83. Ideally the temperature will be much higher later so I'll use it for fire tests (e.g. 1600) and it is very important that I get this down before we use the .vi in the fires of the test.
For some reason, when I write to spread sheet file, I get 1 column of the last data point are met. There is also no time stamp on the left most column. I need to ensure that data are collected on every second and is stored in this file.
I was also wondering if anyone knew how to change the names to write to destination of the spreadsheet (the gall that you create) file once instead of put the path in there. Finally, we will run several tests and we do not want to replace all the tests by accident. Please if someone could help with anything that would be great. Thank you!
Tanya
PS works with version 8.6
Well, we can discuss one thing at a time. First of all, it is a way, you could do the evaluation of Boolean values.
I think that I would split the data collection and processing of data in two loops. Have a loop that takes just the data and another that processes the data. This will also allow a state machine architecture. That would leave you do checks if a file exists before you leave and a few other things.
-
With an average of data points
Hello
My setup is run by labview and wishes to reduce the noise associated with my data by taking more medium.
I would like to have the medium-sized data points and taking the average of them and save only the average at the same time the experience is
instance. For example. My experience is voltage vs field. For each field, I want three readings of voltage and the software must calculate the average, then
Enroll in the average in the data file. The reason why I do not repeat the measurement, it is that it would take some time to do it this way.
Can you advise how to do this with labview.
Thank you very much
Hi Alain,
Take a look at the attached vi. I think that this will solve your problem. It takes the average of the 3 simultaneous values of an array of random number and saves it in the txt file that you need.
Kind regards
Amine31
(Bravo to give good answers, mark it as a solution if your problem is Sloved
 )
)

Maybe you are looking for
-
Definition of automatic locking of 10 IOS
I have updated both my 5s that I use as an iPod and my 6 more for iOS 10. The automatic locking setting function disappeared. I've done this 24/09/16. I did a resynchronization 25/09/16 with the 6s but today still have the problem. Any suggestions? T
-
I need help with my ipod 5
-
How can I get the heritage library in Garageband 10.1.1?
I was watching videos on how to change the song in Garageband, but the most important that have been really of any help that all showed a library under the 'song', 'acoustic guitar' option and "the electric guitar and low" options called "Legacy". Th
-
Toshiba Satellite P70 - response about the service of warranyt
HelloI have a Toshiba Satellite P70. Unfortunately, it was a failure. I reported the accident on the Toshiba site two weeks ago. To date I have not received response. How long I'm going to wait for a response and repair?
-
Toshiba 22L1334G gets stand in automatic mode
Hello I'm an agent of technical support for a multinational company and I write about a problem that we have with the following Toshiba TV: Toshiba 22L1334G - 22 "- L1 Series TV LED." We purchased several televisions to our subsidiaries in different