Metrics polling interval
Selecting a resource, operations, all events, by selecting a metric and download of csv file. Look at data, measures of collective management in 5 minute intervals but see a few instances where the interval is between 10 and 30 minutes. Anyone else seeing similar results? Concern is how this affects the validity of the measures.
OK, the data are there... not a problem with the adapter/collector. Open an SR # with GSS to follow up the matter with the CSV export - they may have a workaround solution known for that, but I'm not aware of one off the top of my head. If it is a new bug, they save and mark for the investigation.
Tags: VMware
Similar Questions
-
24 hours in DBAdapter polling interval
Hello
Is the adapter DB supports the polling interval of 24 hours (86400)?
Please also suggest if performance considerations need to be addressed if we have about 5000 treatment records in the same polling interval (24 hours).
Thank you
Ashutosh SinghAshutosh,
Is the adapter DB supports the polling interval of 24 hours (86400)?
Yes. I do it for some processes.
Please also suggest if performance considerations need to be addressed if we have about 5000 treatment records in the same polling interval (24 hours).
Depends on: 1. how many fields (and size) do you have in each record and total.
2. what you do within the process.
3. how many other processes that you run at the same time.
and so on...In general, you should not ask a performance problem.
Next, test, it is very easy, try to do a little test and see what happened.Arik
-
For metrics collection interval...
I understand that the smaller collection for the metric interval is 1 minute at HQ. I have had to follow a lower interval.
I am tracking a series of processes on a single node and you want to analyze the changes of State (that is to say, start, scheduled events, events generated by users, stop, etc.) in the process. This is mainly to identify bottlenecks and identify processes that may require rationalization. The collection 1 minute interval is not low enough to capture the level of detail, I need.
Any idea of a workaround would be appreciated.Well, if you able to configure the settings to collect the _were_ a
more frequent intervals. The metric data would be inserted in the
database individually as they were collected.Charles
-
Determine if a BPEL Polling DB adapter works
I deployed a composite SOA with a DB Polling of BPEL for Weblogic adapter. I'm trying to tell if it works. I'm looking in the soa_server1 - diagnostic.log and I saw the following message: [2014-10 - 08 T 14: 53:02.753 - 05:00] [soa_server1] [NOTIFICATION] [] [oracle.soa.adapter] [tid: [ASSETS].] [ExecuteThread: '3' for the queue: "(self-adjusting) weblogic.kernel.Default"] [username: weblogic] [ecid: b4de9447a6405836:356834 d: 148f023a253 :-8000-00000000000002ad, 1:21897] [APP: soa-infra] JCABinding = > [NotificationService.SugarCRM_Poll/2.0]: init has been initialized properly first SugarCRM_Poll_db.jca I'm looking in law journal? And that's what I should see every time it works? The jca for the adapter DB poll file looks like this:
< name of the adapter-config = "SugarCRM_Poll" = 'Database adapter' adapter wsdlLocation = "SugarCRM_Poll.wsdl" xmlns =" " http://platform.integration.Oracle/blocks/adapter/FW/metadata ">
< connection-factory location = ' ist/DB/SugarDbProd"UIConnectionName ="SugarDbProd"adapterRef =" "/ >
< endpoint-activation portType operation "SugarCRM_Poll_ptt" = "receive" = >
< className = "oracle.tip.adapter.db.DBActivationSpec activation-spec" >
< property name = value = "SugarCRM_Poll.OpportunityStagingTable" / "DescriptorName" >
< property name = "Nomrequete" value = "SugarCRM_PollSelect" / >
< property name = "MappingsMetaDataURL" value = "SugarCRM_Poll - or - mappings.xml" / >
< property name = "PollingStrategy" value = "LogicalDeletePollingStrategy" / >
< property name = "MarkReadColumn" value = "account_name_new" / >
< property name = "MarkReadValue" value = "X" / >
< property name = "MarkUnreadValue" value = "O" / >
< property name = "PollingInterval" value = "5" / >
< property name = "MaxRaiseSize" value = "1" / >
< property name = "MaxTransactionSize" value = "10" / >
< property name = "NumberOfThreads" value = "1" / >
< property name = "ReturnSingleResultSet" value = "false" / >
< / activation-spec >
< / point endpoint-activation >
< / adapter-config >
I also see this Notification in the soa_server1 - diagnostic.log:
[2014-10 - T 10, 07: 31:05.328 - 05:00] [soa_server1] [NOTIFICATION] [] [oracle.soa.adapter] [tid: Workmanager:, Version: 0, scheduled = false, started = false, queue time: 0 ms\n] [userId: weblogic] [ecid: b4de9447a6405836:356834 d: 148f023a253: - 8000-0000000000000708, 1:19750] [APP: soa-infra] adapter database NotificationServiceBINDING.JCA - 11624 [[DBActivationSpec of the election Exception. Name of the query: [SugarCRM_PollSelect], the descriptor name: [SugarCRM_Poll.OpportunityStagingTable]. Querying the database for events failed on this iteration. Caused by com.mysql.jdbc.exceptions.jdbc4.MySQLNonTransientConnectionException: no operations allowed after connection closed. This exception is considered as reproducible, probably due to a communication failure. To be classified as not reproducible instead, add property nonRetriableErrorCodes with the value '0' for the deployment descriptor (i.e. weblogic - RA.Xml). Polling will attempt new next polling interval.
I am able to test the connection in Weblogic 11 g Admin Console and it works very well. I saw the following message: "Test of TestSugarDataSource on the server soa_server1 was successful." And I was also able to use the netcat command to test connectivity with success. "nc - vz xx.xx.xx.xx 3306' returns a ' Connection to xx.xx.xx.xx 3306 port [tcp/mysql] successful!" So it appears the connectivity is not an issue.
Thank you
Tom Henriksen
Post edited by: Tom Henricksen
I was able to find the question with the modalities of the election by changing the Configuration of log on the oracle.soa to connect more BEAUTIFUL TRACE: 32. This allowed me to see the underlying query running DB Polling adapter and make corrections. The diagnostic log file gave me everything what I needed when I made this change and correct tests. Thank you, Tom
-
FTP adapter limiting polling frequency active time of a day
Hi all
Is there anyway that I can limit the polling interval of the FTP adapter to be active for a period of time during the day. Say, my service must query the location entering data of sales order for each hour for the hours of the day.
Thank you
AG
There are 2 ways to do this
1. create a BPEL program Planner (using quartz) who will write the file trigger in the directory to poll the FTP adapter and the FTP adapter must be enabled on the trigger file.
2 create a BPM process with Timer start event to write trigger file in the directory to poll the FTP adapter.
-
Hi all
I have an af:poll that displays a label when I click on a Save"" button. It displays the label for 10 seconds and then, disappear. I also have the choice to close the message label by clicking on the 'x' button that appears at the same time the label. For the 'x' button function and the pollListener function, I use the same code:
{} public void buttonXClick (ActionEvent actionEvent)
frameLabel.setVisible (false);
pollTimeSet.setInterval(-1);
AdfFacesContext.getCurrentInstance () .addPartialTarget (frameLabel);
}
{} public void clearMessage (PollEvent pollEvent)
frameLabel.setVisible (false);
pollTimeSet.setInterval(-1);
AdfFacesContext.getCurrentInstance () .addPartialTarget (frameLabel);
}
Both perform well, but the other, event survey, continues to call the survey every 10 seconds (the time of my survey). When I click on the 'x' button, the survey event stops, as expected.
The default polling interval is "-1" and changes in the function of the button Save:
{} public void buttonSaveClick (ActionEvent actionEvent)
/ many operations...*/
Important code simplified ;)
changesEmployee.setValue ("a lot of operating result");
frameLabel.setVisible (true);
AdfFacesContext.getCurrentInstance () .addPartialTarget (changesEmployee);
pollTimeSet.setInterval (10000);
}
My question: why the same code does not have the same action? Is there a way to make the second work of function (event survey) as the 'x' button?
Thank you all :)As with most of the components of the ADF, the survey component does not communicate from the client to the server to check if the values have changed unless something triggers to do. So until a refresh any product component of survey on the client side (in the browser) does not know you changed its properties on the server (via Java). A ppr of the component causes freshen up and pick up the property changes.
-
dynamically change the gauge refresh interval
Hello
I would like to show a count value using template so that users can change the polling interval.
I created dvt: gauge, af:poll, af:inputNumberSlider
slider is supposed to set the polling interval.
the problem is valueChangeListener is never triggered.
What is the problem, how do I intercept the new value of the slider?
< af:inputNumberSlider label = "Refresh here" id = "ins1" binding = "#{Customer.ins1}" shortDesc = "refresh rate" "
maximum = "100" inlineStyle = "width: 180px; height: 35px; »
minimum = "-10" partialTriggers = "survey1.
valueChangeListener = "#{Customer.inputSliderChangeListener} '"
majorIncrement = "50" minimumIncrement = "10" / >
or maybe there is a shortcut for the task in general?the value autoSubmit = "true"
maximum = "100" inlineStyle = "width: 180px; height: 35px; »
minimum = "-10" partialTriggers = "survey1.
valueChangeListener = "#{Customer.inputSliderChangeListener} '"
majorIncrement = "50" minimumIncrement = "10".
autoSubmit = 'true '.
/>Thank you
Nini -
Do polling on the DB adapter as a property.
Hi all
I'm doing the polling interval on my db as a prpoerty adapter, then the polling interval gets read from a property file and so I don't have to redploy process when I want to change the polling interval. Is this possible?
Thank you
Kin the case of 11 g and the use of the Ombudsman, you can use the assing in the Ombudsman himself and set the property "PollingFrequency".
http://download.Oracle.com/docs/CD/E15523_01/integration.1111/e10231/adptr_propertys.htm#CIHJIDCHhave not tested, but I guess you can use an xpath in this expression.
and then you can use the getPreferences function to retrieve the values that you can set in the console at run time, see:
http://eelzinga.WordPress.com/2009/10/28/Oracle-SOA-Suite-11g-setting-and-getting-preferences/hope it works :)
-
Port network members, eth2, is not reachable
Recently updated firmware on PS4100 to 7.0.5 with assistance from Dell. Since then, reported the San HQ: "network port, eth2, isn't reachable." Failed to get data for this member network performance. "We have only one Bay EqualLogic. There is no problem until the upgrade of the firmware 6.x. Details:
Group IP: 10.0.10.2
Management IP: 192.168.2.52
Members eth2 IP: 192.168.2.53
24 all subnets on Force10 switches. Machine San HQ on the 192.168.2.0 network, has no access to the iSCSI network (didn't before updating or the other). SAN HQ version is 3.0.1. Both controllers were restarted several times. San HQ machine has been restarted several times. If it was due to a bug (false alert, as seems rather widespread in recent versions), I would just ignore the error that connectivity is restored during the next polling interval. However, the performance data for this period are not seen while the alarm is active, so're missing us huge chunks of data in syslog. I have changed the cables, moved the switch ports, checked the config of the vlan, etc etc etc. Everything looks OK to me, but this fills my Inbox and is quite annoying. Any suggestions?
I opened a ticket. It is a known according to Dell issue and will be fixed in a next version of SanHQ.
-
PowerConnect SNTP sync will not work
I tried everything I can think of to get the time and date on my 6248. I tried to use public, servers NTP stratum 2. I install my own NTP Server Unicast, that is a domain controller in a domain. I tried to turn on with UDP relay broadcasting. I tried to save run at startup and restart the system. I have the latest firmware installed. Nothing works. Can anyone help? Here's my «see the sntp configuration»
Poll interval: 128 seconds
Auth MD5 keys:
Authentication is not required for synchronization.
The trusted keys:
No key to confidence.
Unicast clients: activateUnicast servers:
Voting key server
--------- ----------- -----------
active disabled 192.168.9.9Any help would be appreciated.
B. Schultz
Here's an update: I am connected to the Dell chat support and they found the source of the problem - handling ACL SNTP traffic block. You must have an explicit allow rule in the priority list. In addition, deletion of DOS attack must still be disabled; This has not been addressed in 2.2.0.3. I hope that they will get that because I would use it. I can try to zero in part back on which removal is causing the problem.
B. Schultz
-
Function 'Internet time' will automatically refresh after reboot - please help
I can't get the "Internet time" auto time update function system after restarting the computer in windows 7. He should tell me when the next synchronization will happpen, but this isn't unless I do it manually by clicking on the button update. Then he went after the reboot.
Example: If I click on the clock at the bottom right of the screen and then select "Change date and time settings" and then click on the tab "Internet time" he says: "this computer is configured to synchronize automatically with"time.nist.gov. Then on the next line, he says: "this computer is configured to synchronize automatically on a regular basis. However, I checked that he never does that. Or he tells me when he is going to do.
To temporarily solve the problem, I click on the "Edit settings" button and then click on 'Update Now' and he said, "the clock has been properly synchronized with time.nist.gov on 15/03/2010 at 22:25" for example. I press OK. So far so good. Now the tab "Internet time" has a line that reads, "next synchronization 16/03/2010 at 02:25. Which is 4 hours later, because the specialpollvalue registry variable is set for 4 hours.
THIS IS WHAT I WANTED! But the next time I restart the computer and check under the tab "Internet time", it comes back again tell me what is the next synchronization. And the problem comes back to where it will not refresh automatically. So reboot he kills. All this works fine on another computer with XP. But on a new, clean installation of windows 7 that is not. Am I missing something? Is there a setting I need to adjust so that it can stay active after restarting?
Time Service Tools Windows and settings
http://TechNet.Microsoft.com/en-us/library/cc773263 (WS.10) .aspxAt the end of this document are details on recording the time of Service.
Regarding-
"SpecialPollInterval".
HKEY_LOCAL_MACHINE\SYSTEM\CurrentControlSet\Services\W32Time\TimeProviders\NtpClientVersion
Windows XP, Windows Vista, Windows Server 2003 and Windows Server 2008This entry specifies the special poll interval in seconds for the manual counterparts. When the indicator SpecialInterval 0x1 is enabled, W32Time uses this interval instead of a poll interval determine the operating system. The default value on the domain members is 3 600. The default value on stand-alone clients and servers is 604 800. »
Maybe you will get better results if you set the default value for domain members (3600), rather that I assume you have set for the 2400? He may not know your adjustment because he runs into some unknown to me, another setting? I guess you did not literally any value to read "4 hours" instead of 2400 decimals or whatever is the equivalent of Hex, did you leave in any commas in the value? Sorry for asking that, please don't be offended by the question, but more strange things occur.
-
Hi team, Okay, so what we have observed in our network is that flow-export sometimes causes high interface utilization and as a workaround, we remove and re-add flow export commands. Now there are short burstd of traffic as well, so I want to add a condition where "burst happens 3 times in 60s, then trigger the event". As I cannot test in production router, so I am testing on a lab switch and there is not much traffic on it. txload/rxload is 1 and hence my applet looks like this: sw1-trn-mr3.hyd.shaw.net#sh run | b event manager event manager applet test authorization bypass event tag 1 interface name GigabitEthernet0/4 parameter txload entry-op ge entry-val 1 entry-type value exit-op lt exit-val 1 exit-type value poll-interval 10 event tag 2 interface name GigabitEthernet0/4 parameter rxload entry-op ge entry-val 1 entry-type value exit-op lt exit-val 1 exit-type value poll-interval 10 trigger occurs 3 period 60   correlate event 1 or event 2 action 1.1 cli command "enable" action 1.2 syslog msg "Interface utilization has risen again. " action 1.3 cli command "show proc cpu | append flash:test" action 1.4 cli command "show interface GigabitEthernet0/4 | append flash:test" action 1.6 cli command "show ip cache flow | append flash:test" action 1.7 cli command "show tech | append flash:test" action 2.2 cli command "no ip flow-export source GigabitEthernet0/4" action 2.3 cli command "no ip flow-export destination 192.168.1.1 2055" action 2.5 cli command "ip flow-export source GigabitEthernet0/4" action 2.6 cli command "ip flow-export destination 192.168.1.1 2055" action 2.9 cli command "end" ! end The thing is it does not work. I turned on debugs and I see this. Mar  3 15:30:46: fh_send_intf_fd_msg: msg_type=114 Mar  3 15:30:46: fh_send_intf_fd_msg: sval=0 Mar  3 15:30:46: fh_send_intf_fd_msg: msg_type=114 Mar  3 15:30:46: fh_send_intf_fd_msg: sval=0 Mar  3 15:30:54: fh_fd_intf_process_async Mar  3 15:30:54: fh_fd_intf_param_fetch:I/F=GigabitEthernet0/4 txload=1 Mar  3 15:30:54: intf_value_uint_compare:op1=1 op2=1 ret=TRUE Mar  3 15:30:54: intf_entry_value_check:Returning TRUE Mar  3 15:30:54: fh_fd_intf_event_match: re = 0x5849AA0, num_matches = 1 Mar  3 15:30:54: fh_fd_intf_start_poll_timer: start_t=10000 Mar  3 15:30:54: fh_fd_intf_process_poll_timer: update_t=0 Mar  3 15:30:54: fh_fd_intf_param_fetch:I/F=GigabitEthernet0/4 rxload=1 Mar  3 15:30:54: intf_value_uint_compare:op1=1 op2=1 ret=TRUE Mar  3 15:30:54: intf_entry_value_check:Returning TRUE Mar  3 15:30:54: fh_fd_intf_event_match: re = 0x56D793C, num_matches = 1 Mar  3 15:30:54: fh_fd_intf_start_poll_timer: start_t=10000 Mar  3 15:30:54: fh_fd_intf_process_poll_timer: update_t=0 Mar  3 15:30:54: fh_send_intf_fd_msg: msg_type=64 Mar  3 15:30:54: fh_send_intf_fd_msg: sval=63 Mar  3 15:30:54: fh_send_intf_fd_msg: msg_type=64 Mar  3 15:30:54: fh_send_intf_fd_msg: sval=0 Mar  3 15:31:04: fh_fd_intf_process_async Mar  3 15:31:04: fh_fd_intf_param_fetch:I/F=GigabitEthernet0/4 txload=1 Mar  3 15:31:04: intf_value_uint_compare:op1=1 op2=1 ret=FALSE Mar  3 15:31:04: intf_exit_value_check: re=0x5849AA0, returning=FALSE Mar  3 15:31:04: intf_exit_comb_check:Returning FALSE Mar  3 15:31:04: fh_fd_intf_event_match: re = 0x5849AA0, num_matches = 0 Mar  3 15:31:04: fh_fd_intf_start_poll_timer: start_t=10000 Mar  3 15:31:04: fh_fd_intf_process_poll_timer: update_t=0 Mar  3 15:31:04: fh_fd_intf_param_fetch:I/F=GigabitEthernet0/4 rxload=1 Mar  3 15:31:04: intf_value_uint_compare:op1=1 op2=1 ret=FALSE Mar  3 15:31:04: intf_exit_value_check: re=0x56D793C, returning=FALSE Mar  3 15:31:04: intf_exit_comb_check:Returning FALSE Mar  3 15:31:04: fh_fd_intf_event_match: re = 0x56D793C, num_matches = 0 Only the first time, it returns TRUE. After that, it returns FALSE always and hence the condition "trigger occurs 3 period 60" does not match and hence no event is triggered. Where am I going wrong? Appreciate your help on this.
Thanks.
You have a condition of release of ' lt 1. This means that the burden must fall below 1 until the event to rearm. In this case, it seems that the load is always 1, so you will not see the three events occur. You have to push some of the traffic through this interface to complete your test.
In addition, you are away:
Action 2.1, cli «config t» command
And probably, you will need to extend the first event with a maxrun parameter I am sure that this policy will have more than 20 seconds to run.
-
Shortcomings of bandwidth able to SNMP
Hello!
I created a grapher of cacti bandwidth based on SNMP. Mark is usually 5 minutes, but I needed a resolution more so I put in place for 1 minute. It works great on everything, so the installation of Cacti is fine, but there is something odd about the statistics of the interface identified by a couple of 6506 devices.
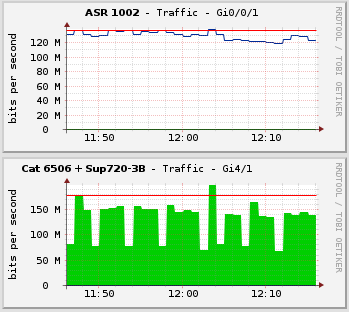
I included a picture. The two graphs are the two ends of the same link. The graphics comes from the end of the ASR1002. The one on the bottom is taken from the other end, a Catalyst 6506 switch with a supervisor Sup720-3B.
Please note the following in the image:
* Gaps, where both have the same question: 1 minute.
* How the ASR as an upper limit of 130 to 140 Mbit/s. The 6506 is 180 to 200 Mbps, which seem to compensate for the shortcomings (at the lower limit of 70 to 80 MB/s).
Additional information:
* I used 'show statistical IG4/1 interfaces' in exact times of 1 minute to develop a table based on the reported 'Tanks In' manually and analyze on a worksheet. I found minimum and maximum extremes similar to those on the graph, instead of a smooth line as in the chart of the ASR.
* I have seen that happen in all interfaces of the 6506. I see this in other 6506 too. ASR is not affected.
* I tried to differentiate the interface to see the output of the two find no significant difference (KeepAlive, being the only big difference).
* The poller interval is global for cacti, so I can't fix the separate intervals, also, I need to have the resolution of 1 minute.
* Both ends of the link are load-interval of 5 minutes. However, because of how SNMP works, should not be just relevant to the readings of SNMP.
Someone has seen something similar? This is due to a misconfiguration or is this a limitation of the platform?
It was the only thing I could think and unfortunately not the right answer. 64-bit counters must be very well even with an interval of 1 minute. I had seen something similar with mrtg for years, with an interval of 5 minutes, anything above about 114 Mbps will give a picture as you see and changing to 64-bit counters was the difficulty.
Sorry, but I don't have any other suggestions for you (but I have to admit that I'm not familiar with the cactus).
Chris
-
Hello
I have a 3850 with NTP configured switch. The connection to the server has been disconnected briefly but after reconnecting NTP was not synchronized.
It would probably start working if I delete and add the median of declaration of the ntp server. But y at - it means to make it work again without having to reconfigure the switch (removing and adding the ntp server)
Model switch SW Version SW Image Mode ports
------ ----- ----- ---------- ---------- ----
* WS-C3850-24 1, t 32 03.06.03.E cat3k_caa-universalk9 BUNDLEClock SWITCH #show
. 09:22:29.466 Thu Sep 15 2016 Greenl
SWITCH #show ntp assaddress Ref clock st when poll reach delay offset disp
~ 172.20.5.49. INIT. 16 127137 1024 0 0.000 0.000 15937.
172.28.10.44 INIT. 16-1323-1024 0 0.000 0.000 16000.
* sys.peer, # selected, + candidate - outlyer, x falseticker, ~ configured
State SWITCH #show ntp
Clock is unsynchronized, 16, no reference clock stratum
nominal freq is 250,0000 Hz, real freq is 250,0050 Hz, precision is 2 * 10
NTP uptime 2378908500 (1/100 of a second), the resolution of 4000
reference time is DB831257. C624DF50 (22:03:35.774 Greenl kills 13 2016 Sep)
the clock offset is 0,0000 msec, delay of root is 0.00 msec
root dispersion is 1.81 msec, the peer dispersion is 0.00 msec
loopfilter State is 'CTRL' (Normal controlled loop), drifting is - 0.000020078 s/s
the system polling interval is 64, update was 127142 sec ago.
SWITCH #.The original post seems to suggest that NTP was working. But I agree with Leo that a starting point would be to specify if the NTP work properly with the current configuration.
The fact that the reference clock shows INIT indicates that this option has not communicated successfully with the NTP servers. Then maybe another troubleshooting step would be to check the connectivity to the servers.
HTH
Rick
-
We have Cisco 2800 to each of our four locations that are managed by our ISP. We had problems with them, I got them to send me the configuration files of one of them, but nothing jumps out to me.
You must disable TCP Window Scaling/tuning on all our Machines 7/Server Windows 2012 (by running netsh interface tcp set global autotuning = disabled in the command line)
If we have not this is very slow to load even a Web page and cannot download a file (even something as small as 2 MB). Mobile devices have no hope to work on our network now because of this. This isn't a question on our XP remaning machines bit, but I think that XP did not use Window Scaling is the reason.
Any ideas what could be causing this? I intend to replace it soon with our own routers, because they do not want to configure the secondary interfaces for our VLAN, but in the meantime I need this job.
Thanks in advanced for any help.
Here is the Config with Sensative information deleted
version 12.3
no service pad
service tcp-keepalives-in
service tcp-keepalives-out
service timestamps debug datetime msec localtime show-timezone
service timestamps log datetime msec localtime show-timezone
service password-encryption
service sequence-numbers
!
hostname REMOVED
!
boot-start-marker
boot-end-marker
!
logging buffered 8192 debugging
no logging console
enable secret REMOVED
!
no aaa new-model
!
resource policy
!
mmi polling-interval 60
no mmi auto-configure
no mmi pvc
mmi snmp-timeout 180
ip subnet-zero
ip cef
!
!
no ip dhcp use vrf connected
!
ip inspect name DEFAULT100 cuseeme
ip inspect name DEFAULT100 ftp
ip inspect name DEFAULT100 h323
ip inspect name DEFAULT100 icmp
ip inspect name DEFAULT100 netshow
ip inspect name DEFAULT100 rcmd
ip inspect name DEFAULT100 realaudio
ip inspect name DEFAULT100 rtsp
ip inspect name DEFAULT100 esmtp
ip inspect name DEFAULT100 sqlnet
ip inspect name DEFAULT100 streamworks
ip inspect name DEFAULT100 tftp
ip inspect name DEFAULT100 tcp
ip inspect name DEFAULT100 udp
ip inspect name DEFAULT100 vdolive
no ip ips deny-action ips-interface
!
no ftp-server write-enable
!
!
!
!
!
!
!
!
!
!
!
!
!
crypto pki trustpoint TP-self-signed-REMOVED
enrollment selfsigned
subject-name cn=IOS-Self-Signed-Certificate-REMOVED
revocation-check none
rsakeypair TP-self-signed-REMOVED
!
!
crypto pki certificate chain TP-self-signed-REMOVED
certificate self-signed 01
REMOVED
quit
!
class-map match-all VOIP
match access-group 120
!
!
policy-map VOIP
class VOIP
priority 1000
class class-default
!
!
!
crypto isakmp policy 1
encr 3des
authentication pre-share
group 2
crypto isakmp key REMOVED address 0.0.0.0 0.0.0.0
no crypto isakmp ccm
!
!
crypto ipsec transform-set VPN esp-aes 256 esp-sha-hmac
!
crypto ipsec profile SDM_Profile1
set transform-set VPN
!
crypto ipsec profile SDM_Profile2
set transform-set VPN
!
!
!
!
!
interface Tunnel0
description $FW_INSIDE$
bandwidth 3000
ip address 10.10.200.1 255.255.255.0
ip access-group 101 in
no ip redirects
ip mtu 1400
ip nhrp authentication VPN
ip nhrp map multicast dynamic
ip nhrp network-id 100000
ip nhrp holdtime 360
ip virtual-reassembly
ip route-cache flow
ip tcp adjust-mss 1360
ip ospf network broadcast
ip ospf priority 20
delay 10
tunnel source FastEthernet0/1
tunnel mode gre multipoint
tunnel key 100000
tunnel protection ipsec profile SDM_Profile1
!
interface Null0
no ip unreachables
!
interface Loopback0
ip address 192.168.210.1 255.255.255.255
no ip redirects
no ip unreachables
no ip proxy-arp
ip route-cache flow
!
interface FastEthernet0/0
description $FW_INSIDE$
ip address 10.10.100.1 255.255.255.0
ip access-group 100 in
no ip redirects
no ip unreachables
no ip proxy-arp
ip nat inside
ip virtual-reassembly
ip route-cache flow
ip policy route-map server-nat
duplex auto
speed auto
no mop enabled
service-policy output VOIP
!
interface FastEthernet0/1
description $FW_OUTSIDE$
ip address IP REMOVED NETMASK REMOVED
ip access-group 102 in
ip verify unicast reverse-path
no ip redirects
no ip unreachables
no ip proxy-arp
ip nat outside
ip inspect DEFAULT100 out
ip virtual-reassembly
ip route-cache flow
load-interval 30
duplex auto
speed auto
no mop enabled
!
interface FastEthernet0/1/0
load-interval 30
!
interface FastEthernet0/1/1
!
interface FastEthernet0/1/2
!
interface FastEthernet0/1/3
!
router ospf 100
log-adjacency-changes
passive-interface FastEthernet0/0
passive-interface FastEthernet0/1
passive-interface FastEthernet0/1/0
network 10.10.100.0 0.0.0.255 area 0
network 10.10.200.0 0.0.0.255 area 0
network 10.10.201.0 0.0.0.255 area 0
network 192.168.210.1 0.0.0.0 area 0
!
ip classless
ip route 0.0.0.0 0.0.0.0 REMOVED
ip route REMOVED NETMASK REMOVED
ip route REMOVED NETMASK REMOVED
ip route REMOVED NETMASK REMOVED
!
ip flow-capture ip-id
ip flow-capture mac-addresses
ip flow-top-talkers
top 10
sort-by bytes
cache-timeout 30000
!
ip http server
ip http authentication local
ip http secure-server
ip nat pool nat REMOVED netmask REMOVED
ip nat inside source list 150 interface FastEthernet0/1 overload
!
access-list 100 deny   ip 10.10.200.0 0.0.0.255 any
access-list 100 deny   ip host 255.255.255.255 any
access-list 100 deny   ip 127.0.0.0 0.255.255.255 any
access-list 100 permit ip any any
access-list 100 deny   ip 10.10.201.0 0.0.0.255 any
access-list 101 remark Tunnel ACL
access-list 101 deny   ip REMOVED 0.0.0.7 any log
access-list 101 deny   ip host 255.255.255.255 any log
access-list 101 deny   ip 127.0.0.0 0.255.255.255 any log
access-list 101 permit ip 10.10.100.0 0.0.0.255 10.10.110.0 0.0.0.255 log
access-list 101 permit ip 10.10.100.0 0.0.0.255 10.10.120.0 0.0.0.255 log
access-list 101 permit ip 10.10.100.0 0.0.0.255 10.10.130.0 0.0.0.255 log
access-list 101 permit ip host 10.10.100.10 any log
access-list 101 permit ip host 10.10.100.12 any log
access-list 101 permit ip host 10.10.100.20 any log
access-list 101 permit ip host 10.10.100.21 any log
access-list 101 permit ip host 10.10.100.45 any log
access-list 101 permit ip any host 10.10.100.10 log
access-list 101 permit ip any host 10.10.100.12 log
access-list 101 permit ip any host 10.10.100.20 log
access-list 101 permit ip any host 10.10.100.21 log
access-list 101 permit ip any host 10.10.100.45 log
access-list 101 permit ospf any any
access-list 101 permit icmp any any
access-list 101 deny   ip 10.10.100.0 0.0.0.255 any log
access-list 101 permit ip 10.10.110.0 0.0.0.255 10.10.100.0 0.0.0.255
access-list 101 permit ip 10.10.120.0 0.0.0.255 10.10.100.0 0.0.0.255
access-list 101 permit ip 10.10.130.0 0.0.0.255 10.10.100.0 0.0.0.255
access-list 102 remark Outside ACL
access-list 102 permit tcp host REMOVED host REMOVED eq 22
access-list 102 permit tcp REMOVED 0.0.0.15 host REMOVED eq 22
access-list 102 permit udp any host REMOVED eq non500-isakmp
access-list 102 permit udp any host REMOVED eq isakmp
access-list 102 permit esp any host REMOVED
access-list 102 permit ahp any host REMOVED
access-list 102 permit gre any host REMOVED
access-list 102 permit icmp any host REMOVED echo-reply
access-list 102 permit icmp any host REMOVED time-exceeded
access-list 102 permit icmp any host REMOVED unreachable
access-list 102 permit ip any host 10.10.100.10
access-list 102 permit ip any host 10.10.100.12
access-list 102 permit ip any host 10.10.100.20
access-list 102 permit ip any host 10.10.100.21
access-list 102 permit ip any host 10.10.100.45
access-list 102 deny   ip 10.10.100.0 0.0.0.255 any
access-list 102 deny   ip 10.10.200.0 0.0.0.255 any
access-list 102 deny   ip 10.0.0.0 0.255.255.255 any
access-list 102 deny   ip 172.16.0.0 0.15.255.255 any
access-list 102 deny   ip 192.168.0.0 0.0.255.255 any
access-list 102 deny   ip 127.0.0.0 0.255.255.255 any
access-list 102 deny   ip host 255.255.255.255 any
access-list 102 deny   ip host 0.0.0.0 any
access-list 103 permit ip REMOVED 0.0.0.15 any
access-list 103 permit ip 10.10.200.0 0.0.0.255 any
access-list 103 permit ip 10.10.100.0 0.0.0.255 any
access-list 103 permit ip 10.10.110.0 0.0.0.255 any
access-list 103 permit ip 10.10.120.0 0.0.0.255 any
access-list 103 permit ip 10.10.130.0 0.0.0.255 any
access-list 110 deny   ip host 10.10.100.12 10.10.110.0 0.0.0.255
access-list 110 deny   ip host 10.10.100.12 10.10.130.0 0.0.0.255
access-list 110 deny   ip host 10.10.100.10 10.10.110.0 0.0.0.255
access-list 110 deny   ip host 10.10.100.10 10.10.130.0 0.0.0.255
access-list 110 deny   ip host 10.10.100.20 10.10.110.0 0.0.0.255
access-list 110 deny   ip host 10.10.100.20 10.10.130.0 0.0.0.255
access-list 110 deny   ip host 10.10.100.21 10.10.110.0 0.0.0.255
access-list 110 deny   ip host 10.10.100.21 10.10.130.0 0.0.0.255
access-list 110 deny   ip host 10.10.100.45 10.10.110.0 0.0.0.255
access-list 110 deny   ip host 10.10.100.45 10.10.130.0 0.0.0.255
access-list 110 permit ip host 10.10.100.12 any
access-list 110 permit ip host 10.10.100.10 any
access-list 110 permit ip host 10.10.100.20 any
access-list 110 permit ip host 10.10.100.21 any
access-list 110 permit ip host 10.10.100.45 any
access-list 120 permit udp any any eq 5060
access-list 150 deny   ip host 10.10.100.10 any
access-list 150 deny   ip host 10.10.100.12 any
access-list 150 deny   tcp host 10.10.100.20 any eq 3389
access-list 150 deny   ip host 10.10.100.21 any
access-list 150 deny   tcp host 10.10.100.45 any eq 22
access-list 150 deny   tcp host 10.10.100.45 any eq 443
access-list 150 deny   udp host 10.10.100.45 any eq 5060
access-list 150 deny   udp host 10.10.100.45 any range 10000 10500
access-list 150 deny   ip 10.10.110.0 0.0.0.255 any
access-list 150 deny   ip 10.10.120.0 0.0.0.255 any
access-list 150 deny   ip 10.10.130.0 0.0.0.255 any
access-list 150 permit ip 10.10.100.0 0.0.0.255 any
!
route-map server-nat permit 10
match ip address 110
set ip next-hop 10.10.200.3
!
!
!
!
control-plane
!
!
!
!
!
!
!
!
banner motd ^CC
<@@@@@@@@@@@@@@@@@@@@@@@@@@@@@@@@@@@@@@@@@@@@@@@@@@@@@@@@@@@@@@@>
Authorized access only
<@@@@@@@@@@@@@@@@@@@@@@@@@@@@@@@@@@@@@@@@@@@@@@@@@@@@@@@@@@@@@@@>
Disconnect IMEDIATELY if you are not an authorized user !
^C
!
line con 0
login local
transport output telnet
line aux 0
login local
transport output telnet
line vty 0 4
access-class 103 in
privilege level 15
login local
transport input ssh
line vty 5 15
access-class 103 in
privilege level 15
login local
transport input ssh
!
end
Hello Jason,
you will find articles from may saying that MS AutoFix feature does not work well with some firewall stateful inspection and/or VPN.
At CSC, I found another interesting:
https://supportforums.Cisco.com/thread/2169557
Maybe Joseph joins this discussion later with some new or additional information.
Best regards
Rolf
Maybe you are looking for
-
MacBook Pro (13 inch, late 2011) Photos Application uses the 'themes' located in Mac HD > library > Application Support > iPhoto If this is not the case, can I delete the iPhoto folder? In addition, remove the iWorks and iLife files? I use Pages and
-
Past POP IMAP in El Capitan - big mess!
Past my account POP of Comcast to IMAP, in order to better coordinate the Mail (9.3) on my iMac (El Capitan 10.11.4), with a Macbook Pro (also El Capitan 19.11.4) an I Pad (latest IOS) and an old iPod. Now I can receive and send messages on all devi
-
Unknown devices after installing Vista on Satellite Pro U200
Yesterday, I installed vista ultimate, but unfortunately my U200 is not compatible with vista because the tile would make me believe.What does not work I have identified to date:-Speakers and headphone jack-Function keys-Fingerprint reader Almost any
-
NOR could they fix these links of attachment?
I am trying to create my own UI (LabVIEW) and ran into the problem here. Another broken link. Could someone at OR fix the links to attachments? Note: I'll actually through the TestStand II next excersize 5-2 and 2003 customization course material tha
-
How can you speed up the system clock
Hello I want to know how you can speed up your system clock?