tiara spectrogram Interpolation
Hello
I have an a spectrogram data set the faster the rotation of a machine:
a vector of length m with speed values
a vector of length n with the frequency values
a matrix with dimensions m x n with the values of sound pressure level
The problem is for the various measures I have slightly different speeds in my data record.
I want to interpolate the data of amplitude to a grid of speed defined by me, for example, 110, 120, 130... 2000 rpm,
regardless of the speed at which the measurement was taken, which can be, for example, 107, 114, 121... 2004 RPM.
With the linear 1 d of DIADEM analysis tool that's doable, but a bit complicated.
Is it perhaps a 3D tool in Diadem for interpolation that I need?
Thank you
Yannis T.
Hello Yannis,
Yes, DIAdem supports 3D interpolation. In the ANALYSIS, go to 'Area' and 'Interpolation '. You have several settings to set up your interpolation. 'Result Points' tab, you can choose "result Points take channel ' (for each, direction X and Y). This means, if you set a channel with your RPM (110, 120, 130,...) you can select this channel as result values (grid of X or the axis Y).
Greetings
Walter
Tags: NI Software
Similar Questions
-
Hello!
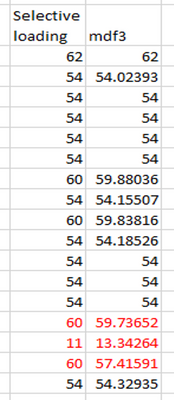
I wanted to ask nicely if it is possible to load a .dat file using the use mdf3 but slaughter the interpolation process it does automatically, instead of linear interpolation I just want to keep the original values of the raw file...
I tried different ways for example: when I open selectivly it gives me the original channels but it lost certain values (size = 3426)... When I load the entire file he realizes the (unwanted) interpolation bt gives me complete channels (size 3443). Any ideas?
Thank you!!!
HI Maria,
I don't know any DataPlugins file that automatically perform interpolation when loading the data values-based. Could you post or send this data file that has the values you have posted?
Brad Turpin
Tiara Product Support Engineer
National Instruments
-
Point of intersection between the line interpolated in Grapher
How to find the point of intersection between interpolated lines using points offered as input to a file in grapher comps?
What version of Mac OS X?
-
Hello
I would like to smooth out motion of my linear motor. For example, I would like to start a program on the cRIO in scan mode Let's say 1ms interval scan and then perform the interpolation between the points of output (for example, the wave of fishing) on the scan interval 100us. FPGA I wrote programs little but my linear motor does not move. I can't find where I made a mistake or / and something is missing.
Any help would be approciated.
I put in the attachment of my FPGA file, but also the host file I have on the cRIO.
Thank you.
Kamil
Dear Alex,
Thank you interested in my topic. I just understood how do. I went by this example: http://www.ni.com/product-documentation/3598/en/. However I have modyfied somewhat FPGA interpolation method. One described is nove myself smooth enough movement. I have attached files if anyone will need one day. I think that the case is closed.
-
Problem mit Kennfelddarstellung/Interpolation
Hallo,
Combi DIADEM-Neuling (Version 2012) bin und habe zwei problem:
Dazu:
Die representation meines efficiency-Kennfeldes mit dem Diadem Viewer values ranges erzeugt, die're enter kann nicht (rote Beriech über 100% Max-Wert bei obwohl ~ 92%), see 160927_Bereich 2_Triple_Darstellung.jpeg).
Woran kann das liegen und gibt are possibilities die Interpolationsart zu verandern?
Zweitens:
Den zwischen Die Interpolation erzeugt "Uberschwingungen" points (see Grafik Uberschwingen, rot umrandeter Bereich), gemeint sind die Auswölbungen zwischen den zur Seite hin rights points.
Vielen Dank im voraus!
Beste Grüße
Hello student_dcb,
dependent von den Daten, die 3D-Interpolationsalgorithmen von gut arbeiten. Aus diesem Grund support wir ab DIAdem 2015 drei distinct procedure: uberarbeiteten SISPL, SCADI linear und einen (zusammen mit Teillasten). Bitte auf die angehangte Grafik once schau.
Gruss
Walter
-
Hello
Just a general question about the tiara. Can DIAdem fast fourier transformation, smoothing of curves, differentiation and integration of graphics? What are the features of DIAdem compared to other graphics packages?
Thank you.
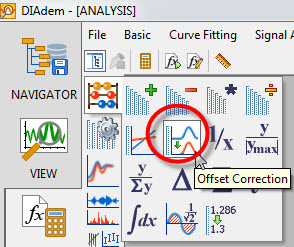
The CORRECTION of OFFSET feature that should do it for you:
In the Panel ANALYSIS, take the first library called 'Functions of channel' - offset Correction
The dialog box that opens, you should get where you need to be...
Otmar
-
Edge detection that VI has the interpolation is mentioned. I want to know the types of interpolation and how it will work. If anyone knows please explain.
There are mainly three types of interpolation used aboard to find IMAQ VI or any other edge vi.
-Help of VI http://zone.ni.com/reference/en-XX/help/370281AA-01/imaqvision/imaq_find_edge/
Order zero (0) Rounds to the nearest place of built-in edge
Bilinear (1) Uses bilinear interpolation to calculate the location of the edge
Bilinear fixed (4) (Default) Fixed-point of bilinear interpolation calculation is used to determine the location of the edge
-See the topic of accuracy subpixel for interpolation works in here http://zone.ni.com/reference/en-XX/help/372916T-01/nivisionconcepts/edge_detection_concepts/
- And this wiki on bilinear interpolation can help https://en.wikipedia.org/wiki/Bilinear_interpolation#Application_in_image_processing
-
Tiara of exit without displaying message to save c#
Hello
So I wrote a c# program that uses the tiara to extract data from a file. It works great with help I asked a few days ago, but I'm looking for a change to make the program even easier use.
I use TOCommand oDIAdem = new TOCommand (); to control the tiara in my c# program that works very well, but I hope that there is a way to remove the output dialog box that appears when the program ends. I've attached a screenshot of the output dialog box that appears. It is not a huge problem, but I would like to make the simplest possible program for the person using it. Any help is greatly appreciated.
Thank you!
oDIAdem.CmdExecuteSync ("datadelall (1)")should be an easy fix. It erases just the portal.
-
Export to a CSV of tiara does not produce a CSV file!
Seems strange but exporting to a CSV of tiara does not a CSV file. Tiara produces a tab delimited file, which is obviously not a CSV file. Tiara aid said even the 'CSV' file is a tab-delimited. The software expects a comma as delimiter does not read the file properly created tiara. It is possible to specify the correct delimiter?
You can ask the decimal/separator, you need if you start exporting CSV from a script
Call DataFileSave ("
C:\temp\EXAMPLE.csv See also http://forums.ni.com/ni/board/message?board.id=60&message.id=8851&query.id=146775#M8851
-
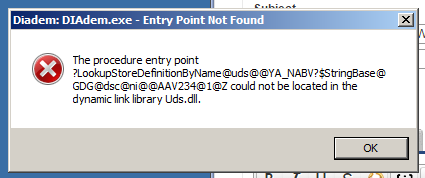
Tiara 2015 fails to start (Win 7)
Whenever I try to start DIAdem 2015 on my Windows 7 computer, I get the error ' tiara: DIAdem.exe - Entry Point not found ". Here is a picture of the screen of the error.
I tried to reinstall both camps tiara but get the same error. (I also tiara 2012 on my PC and it worked fine before, now who is also giving the same error).
Also DataFinder.exe doesn't and fails with the same error. One of the messages said to reinstall OR ICU from the DVD DIAdem will correct this problem. I found NEITHER-ICU Version 15 on the DVD and tried to install it, but the installer would not install 15 NOR-ICU and says that it cannot install because a newer version is already installed. I can't find OR ICU under control panel > programs and features >, so I can't uninstall the ICU-OR corrupt that is probably causing all these errors.
Can you please help? Thank you.
Hello RagMan,
I agree that the ICU is probably damaged. It seems that you have a mixture of old and current ICU binary on your hard drive, which causes this error.
It's very special and I like to discuss possible solutions with you - of course, I'll post the result here.
Please post here your e-mail address so I can contact you.
Thank you, Dieter
National Instruments Engineering GmbH & Co. KG
-
2D axis graduation Bug in reports (Tiara 2014)
Hello
I ran across a rarther annoying bug in 2D for reports of scale axis. Here's how to recreate:
- Load a dataset that contains the x and y components.
- Create a new presentation in the report tab
- In Sheet1, add a Simple 2D axes system.
- Select x and y of the dataset object and drag it in the 2D axis system.
- Change the scale of "Completely automatic" to "manual".
- Change the number of "Begin" to something near the tiara set by default. Do not touch the number of 'end '. Click OK.
- Add Sheet2 and repeat steps #3 to #6 on Sheet2 with a different dataset.
- The two parcels well look now...
- Go to Sheet2 and double click on the map to reveal the curve and the definition of the axis.
- Do not touch anything... just click on "Cancel".
After you click Cancel, the scale of the axis 2D completely changes. I think what is happening is that the tiara takes everything the previous issue of 'End' was and who uses instead the number of 'End' you want. In addition, you have not actually to enter the curve and the definition of the axis to create this bug. Press cancel if you change something like text (for example)... curious bye bye.
Also, if I go back the and redefine scaling on automatic mode, click Preview to update the plot, then opt for the manual mode, all seems good. However, if I copy Sheet2, the plot on Sheet2_Copy1 is messed up the same way as if Sheet2 is OK, but I hit Cancel.
Worse still, the undo function does not work on this unwanted change of scale.
This is a bug that makes plots in the report almost unusable files. I hope it's re-producable on other systems if a patch can be issued. Let me know what you find.
The only solution I found is to click OK instead of cancel, which is not always preferred.
Thank you
Jacob
Hello jrasco,.
You are right. There is a bug in DIAdem 2014. We have set for the DIAdem service pack.
Here is the link to the 2014 DIAdem English SP1
Thank you
Walter
-
Hello
I use DIAdem 2011 SP1.
I have a chart with a curve as "filled area.
The parameters of the curve of the backfilled area are:
Line color: Blue
...
Color fill: Blue
Transparency: 90%
Transparency is necessary, otherwise the grid is hidden by the area filled in the diagram.
Tiara shows the report correctly, but in the file exported PDF zone is in blue with no transparency.
(The area was backfilled black in the file PDF if DIAdem 2010 is used.)
(The report is printed correctly directly from tiara).
If anyone can help with this?
Hi Johann,.
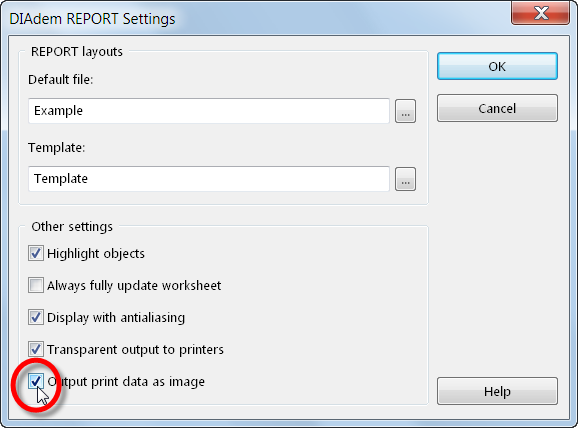
The PDF driver that installs with DIAdem does not support transparency. However, starting with DIAdem 2011 you congifure REPORT to restore each sheet as a PNG image in high definition and send those PDF driver rather than the gross REPORT screens. Select the settings menu > Options > REPORT... and then check the box 'print output as image data.
Brad Turpin
Tiara Product Support Engineer
National Instruments
-
HI, I use Labview and tiara to test and grind outages of a complex engine system where I want to put the engine 3D model in a screen and highlight or annotate instructs the operator for failure and repair. How should I do for the optimal design of these 2 products?
Hi id,.
Look at exercise 7 in the following exercises of Hands-on tiara (older). I dropped this exercise in future versions, but the process has not changed since then.
in the event that the link above does not work, here is the General web page:
http://zone.NI.com/DevZone/CDA/EPD/p/ID/5393
Brad Turpin
Tiara Product Support Engineer
National Instruments
-
With the help of tiara, how to get the slope of a signal (linear or nonlinear)
Speed of rise or precipitation rate and the temperature of the signal, I am trying to sign up the slope in my report using DIAdem,
I could not find, is there a function of slope?
or a way to do
Thank you
Na'amat salvation,
You can get the calculation of the slope to climb the built-in "ANALYSIS > Curve Fitting > calculate regression." If you want to adjust only a subset of the data, you will need to extract this subset of data to a new data channel, and then initiate the calculation of reconciliation on the new channel.
Here is a script I created to do the calculation of extraction and statistics/slope range automatically.
Brad Turpin
Tiara Product Support Engineer
National Instruments
-
How to customize the tool tiara?
Hello
Problem
Is there for me to add custom button or feature in tiara using LabWindow program?
Requiremnts
Custom button will run my not enforcement next CVI:
- import a binary file to another format to CSV
- automatic load this file into DIAdem
- view the graphical display
- Auto save CSV format TDM/PDM
- Run the report.
Please take a look at www.ni.com/dataplugins. There is a link 'the DataPlugins programmer reference guide' with the manuals and documentation. The language is VBScript. VBScript is used as a kind of glue code to set up the functions doing the real work.
Maybe you are looking for
-
How can I move folders of your email ACCT. within Mozilla?
Change my e-mail provider and would like to move my existing folders and their content to the new account.Thank you
-
HP pavilion dv6-1030us: enter the administration password or power on password
I can't open my laptop... display enter administrator password or power onnpassword... System code is 54483768 Please help me
-
Tried to delete a text message thread and it will not remove goes right down and the date says December 1969 can anyone help? Thank you
-
My computer date and time is always bad.
I continue to correct the date of my computer and time but the date and the time is always bad when I restart.
-
Gadgets do not work correctly for windows 7
Gadgets do not work properly. When I start the clock gadget it appears black, for the CPU meter only square White appears. What should I do? Please answer...