type axis 2d
Hi all
I am writing a script to draw graphics, and I would like to change the type of some of them to the "curve of step. How can I do? Here is my script;
Option Explicit ' force explicit declaration of all variables in a script.
Dim oMySheet, oNewArea, channel, channels
Call View.Sheets.RemoveAll
Set oMySheet = View.Sheets.Add ("graphics Boilers 1-5")
Set oNewArea = oMySheet.ActiveArea
oNewArea.DisplayObjType ("CurveChart2D")
Presets = Data.GetChannels("[1]/*ALL*")
FOR each channel in the channels
Call oNewArea.DisplayObj.Curves.Add ("[1] / Time", Channel.GetReference (eRefTypeIndexName))
"You're looking for boiler 1.
NEXT
Dim Boiler1Term1, Boiler1Term1s
Set Boiler1Term1s = Data.GetChannels ("[1] / * boiler 1 M2G Terminal *")
FOR each Boiler1Term1 in Boiler1Term1s
Call oNewArea.DisplayObj.Curves.Add ("[1] / Time", Boiler1Term1.GetReference (eRefTypeIndexName))
Dim Boiler1GV, Boiler1GVs
Set Boiler1GVs = Data.GetChannels ("[1] / * gas boiler 1 *")
FOR each Boiler1GV in Boiler1GVs
Call oNewArea.DisplayObj.Curves.Add ("[1] / Time", Boiler1GV.GetReference (eRefTypeIndexName))
NEXT
View.Sheets ("graphics Boilers 1-5"). Areas ("area: 1"). DisplayObj.YScaling = "n [physical] systems."
Call WndShow ('VIEW', 'Open')
Next
Thank you very much
Estefania
Hello
There is an object property that specifies the type of curve on a 2D axis chart. You can read about it in the article below;
So should be just... oNewArea.Type = 'Step' curve
Hope this helps, let me know if you have any questions.
Thank you
Josh
Tags: NI Software
Similar Questions
-
You cannot change the chart value axis when there are several types of graphics in a single diagram
Illustrator can do graphics with bars and lines / columns, for example in the docs:

http://help.Adobe.com/en_US/Illustrator/CS/using/WS3f28b00cc50711d9fc86fa8133b3ce158e-8000 .html
However, when I create a chart like this, I seem to lose the ability to manually set the y-axis using 'override calculated values.
To reproduce this problem:
- Create a chart as in the example, with bars and an axis on the left, lines and an axis on the right. Unlike the example, don't fix the numbers as well as the lines align perfectly - have a go until just less than 20, a up to a little less than 250, therefore it do not markers and the number of divisions on each side.
- Try to make the markers and numbers of divisions to the height, so in fact, the side that is going up 20 going up to 25 and has the same number of divisions on the other side.
Everything I have tried does not work:
- If I select the entire chart and go to the "Chart Type", I can not set the options for the value axis. In earlier versions, it's gray, in CS6 I can access, but clicking on 'OK' does nothing.
- If I select the entire chart and chose the type of a chart, I can set options for the axis value, but that the selected chart type, and then applies the entire table.
- If I use the direct Selection tool to select one of the series and open the "Chart Type" options, changing the options of the y-axis has no effect
- If I use the direct Selection tool to select all series that share an axis and open the "Chart Type" options, changing the options of the y-axis always has no effect
- If I use the direct Selection tool to select the Group of ticks axis itself, or the axis line and groups of ticks axis themselves, of axis labels, axis and graduations of the axis line, or axis labels, axis line, graduations of the axis and series of related data, etc., by changing the options of the axis also has no effect
It seems that this feature is broken and it seems that the example in the manual has been carefully chosen to use a rare combination of numbers where it would actually look right.
I thought about it. Like everything to do with the horrible ancient neglected graphic Illustrator tool, it is ridiculously clumsy and involves the caution around what is shamefully bad programming for a professional expensive product.
It is timing - to do things in a sequence of rigid counterintuitive that seems not to work then meets at the end:
- Create the chart but, for now, keep all the same chart type. If you've already set to have different graphics types, put the same thing for now.
- Select the entire chart and in the main window of Chart Types, set the value to "Both sides" axis
- In the drop-down menu, there should be a left and right axis (or top and bottom...). Set the parameters of the value axis for these now. It will look like it does for a single axis, because it will not change the other axis - naked with her...
- Select the data series you want to use the other axis using group selection. Go to graph Type and the value of the y-axis to the other and set the chart type that you want. All of a sudden all be put in place.
- If you need to change the settings for the value axis, select the entire chart, set the whole chart type to a chart, change the appropriate value axis by choosing it from the menu drop down and the re - apply types of graph as above.
(the bug is - it should not necessary to set the graphic object to only have only one chart of type in order to access the axis options of value for two different y-axis)
-
Is it possible to set the axis prior to 'spin' on a form or a sub-channel
After clicking on a shape or subcircuit in mode 2D structure of EM, there are "rotation" and "flip" command in the context menu. Is there a way to enter precisely into the axis to the plane of rotation and symmetry to overthrow?
I misread the original question, sorry.
After launching the rotate or flip command, the first place you click with the mouse will define the origin of the flip or rotate it. You can hold down the Ctrl key to align with the peaks forms or you can type Tab to use the space bar to get in the coordinate entry model to enter an exact coordinate as the origin of the flip or rotate.
-
SignalExpress-Sweep type configuration problems
Hello
I am creating an analog signal with a sweep to make the change in the frequency of my signal.
I chose "Sine wave" as a type of signal.
Then, configuration of the scan, I have a problem.
Indeed, the type of configuration, I have chosen is "exponential" (so that the frequency varies from exponentialy). But the graph on the right side of the window as if I had chosen linear.
When I'm runing the VI, does the frequency varies from exponentialy but the graph remains as if it were varying linearly.
Is this a bug?
Is anyway to remedy?
Thank you very much for your answers.
Hello
This is the normal behavior.
If you take a look whenever you change between exponential and linear from the point to the graphic evolution. For example, if 1 k to the exponential value, the value of iteration is 400, Linear 1 k the value of iteration is completely different. In fact, this graph does not show you values like a curve, because when you assign exponential the y-axis becomes exponential, so the graphic scale variations becomes exponential but not the curve.
Please let me know if you have any doubt.
Thank you.
Best regards.
-
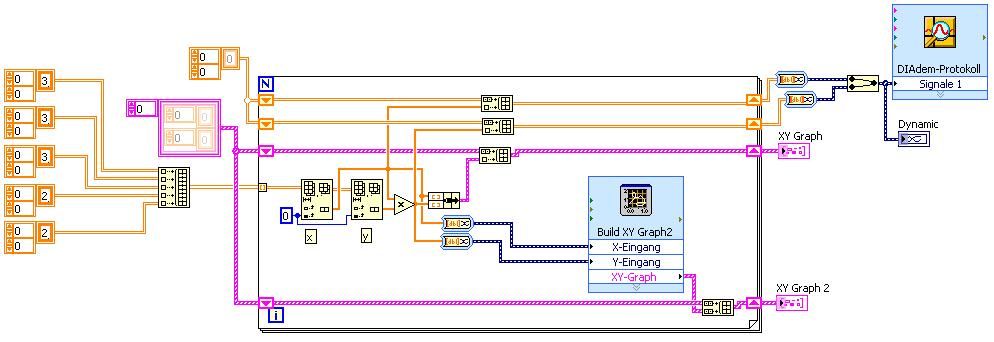
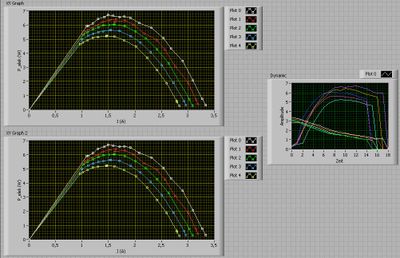
Plot multiple charts XY (dynamic data type)
Hello world
I searched but could not find the solution. I'm tracing several XY graphs with dynamic data type.
I have here an example five 2D-arrays of X/axis Y to draw.
I need them in dynamic data in order to trace in Diadem using Diadem protocol.vi.
I get all the values of the X/Y axis as values Y.
Any help is really appreciated,
Yan.
-
Secondary axis on the WPF chart
Hello
I'm tracing a secondary value axis on my WPF chart. I have a graphic linked to a table of AnalogWaveform
of objects that I change during execution. This table can be different sizes depending on the user's selection, however assume that there are two types of data to the chart. I would like to match a data type of my main axis and the other guy to my axis is secondary. For example, I have four AnalogWaveform
opposes the plot, two of whom are in Hz (primary) and the other two in Volts (secondary). According to the documentation, I need an additional of
element under my definition of . What I have is:
This adds a second value axis to the left of my main axis. What I need is for this axis which will be located to the right of my chart and somehow to draw each
AnalogWaveform on the right y-axis. I build my locations in the code as follows:
_graph. Plots.Clear ();
RawData is my AnalogWaveform[], built in advance based on a response from the server
foreach (AnalogWaveformwaveform in RawData)
{
If (waveform! = null)
{
field = new plot (waveform. ChannelName);
parcel of land. DataContext = waveform;plots. Add (Plot); plots is a simple list
}
}_graph. Plots.AddRange (studs); Add locations to graph
_legend. ItemsSource = plots. Add locations to the legend
Any help would be appreciated on how to do it.
Thanks in advance.
To position your second Y axis across the graph, set the
Locationproperty on the axis ofFar.To associate a plot to a default axis, set the
VerticalScaleproperty on the ground in the axis value is appropriate. -
Error 'Could not find type' in 2013 VS designer
I use VS 2013 with Measurement Studio 2013. I know that there is no integration VS 2013 supported, but it is very good and so far I've been able to work around this using the proposed methods (e.g., generation of the licx file manually). However, I now use on a question which, I'm afraid is a bug of Visual Studio (and not a problem with NEITHER), but I wonder if anyone has experienced this.
Before today, I had a job perfectly Windows Forms project with a single form. This form includes some NationalInstrument.UI.WindowsForms.WaveformGraphs. For some reason and I don't know what changes caused this, when I open the VS designer to this form, I now am facing a screen for error registration 3 errors. They are all the same shape and say:
Type 'NationalInstruments.UI.WaveformPlot' was not found. Please make sure that the assembly that contains this type is referenced. If this type is a part of your development project, make sure that the project has been properly built using settings for your current platform or Any CPU.
For two other errors, the type of WaveformPlot is changed to XAxis and the x-axis. The project is referencing correct (NationalInstruments.UI, NationalInstruments.Common, and NationalInstruments.UI.WindowsForms) libraries and I'm building x 86 and SEO only x 86 versions of libraries. After all, this all worked before apparently without change.
I even went back to the previous building control points within our source control tree, I know with certainty before, but the error persists.
I saw the same behaviour in VS before and sometimes you can remedy the situation by a combination of black magic, for example cleaning, removal of directories bin and obj, reconstruction, restart etc, but in this case, none of these things seem to work. I'm pretty experience when it comes to VS and Windows Forms development and have tried most of the solutions you might think first of all, I'm looking for someone who has been in this situation before. Thank you!
Please take a look at this post: forums.ni.com/t5/Measurement-Studio-for-NET/Designer-mode-error-VS2013/td-p/3133063
-
Hello
I have attached a sample vi in format zip and subvis.zip. In this vi, I have an output waveform which I got after each run. I circled this waveform output in red to the "waveform.jpg".
Now, what I want to do is;
I want to change the x-axis of waveform (red circled in the "waveform.jpg" scale of real time (but only in a few seconds) as the one given in attachment (second digit).
I tried many things, but do not allow to get.
Please help me!
Mech,
In your University chart, go to 'ladders '. In your time (x axis), under scale factors, type 0.001 in the multiplier section.
Kind regards
Lucither.
-
DateTime on x-axis of the graph of the intensity
How can the x-axis of a graph of intensity be configured to the DateTime data type, similar to the graphic waveform XAxis? You can set the FormatString DateTime MajorDivisions, but has no way of installing the x-axis values. Waveform curve has a foot (double [], DateTime, TimeSpan) function that will implement the XScale with the correct DateTime values, but the graphic intensity doesn't seem to have a similar capability. I tried to configure the graphic intensity YAxis MajorDivisions DateTime Format string and pass then the plot function Tick values for the yScaleStart and YScaleIncrement, but it does not work probperly. MS2012 release notes say that the curve of intensity has now an automatic formatting for displaying DateTime on axes X and Y. I tried to use this feature to test the DateTime X and the ability to axis Y; However, the function of automatic formatting is not available for the chart of the intensity. Any help is appreciated.
Thank you!
Jon
Hello
Try the following code piece.
            // Set the label format correctly            intensityYAxis1.MajorDivisions.LabelFormat = new NationalInstruments.UI.FormatString(NationalInstruments.UI.FormatStringMode.DateTime, "g");
            intensityYAxis1.Mode = NationalInstruments.UI.IntensityAxisMode.AutoScaleExact;

            double[,] data = new double[100, 100];

            for (int i = 0; i < 100; i++ )
            {
                for (int j = 0; j < 100; j++ )
                {
                    data[i, j] = (i + j) / (colorScale1.Range.Interval * 2);
                }
            }
            // IntensityGraph only understands double values. But graph can interchange the data value from different types using the DataConverter provided by NI.
            intensityPlot1.Plot(data,
                0,
                1,
                (double)DataConverter.Convert(DateTime.Now, typeof(double)),
                (double)DataConverter.Convert(TimeSpan.FromDays(1), typeof(double)));
It will be useful.
Habim stone
National Instruments
-
Hello
I am trying to reverse the order of the y-axis of my 2D plot (do decrease).
I use Diadem 2012.
I see that in earlier versions, there was a selection "mirror...". ', but in Diadem 2012 I couldn't find it...
Any suggestions?
Kind regards
Hi, amel.
Ah, you're right. The 'Scaling Type' property is "DateTime" or "Inverted", not both. You can set it to "Inverted", but then you have to set the "Display Format" property of the string DateTime in data to "Numeric" portal so that the parameter "Inverted" stick. Your axis displays then the number of seconds since the AD instance up and down 0. To display time values date reversed, you must also create a UserCommand that uses the RTT() command and call it as an @ expression of function, passing it the variable CFV, format the y-axis numbers. I can help you to do, but it's not easy or obvious.
Still interested?
Brad Turpin
Tiara Product Support Engineer
National Instruments
-
Problem reading video image from the camera IP Axis - confusion of variant data buffer.
Hi there;
I am writing a VI for an Axis IP camera. He went to work, but I need to extract individual video stream images so I can overlay text using the functions of text IMAQ overlay.
The thing is when I take a picture using the axis dll library (GetCurrentFrame), it returns a buffer size and a Variant representing the raster data. The data is = 921 640 bytes representing a 40 byte header, and then the 640 x 480 x 3 raster data. When I run the vi, I get a correct value for the size of the buffer (921 640) so I know it works.
What don't understand me, it's the video image is placed in a buffer of type variant. I don't quite know how to extract the raster data of the data type of "buffer" which is a type variant. My apologies, I'm a bit ignorant in how to handle the types of "Variant".
Does anyone have a suggestion?
This is the VI
Hi Peter,.
Just to confirm, what IMAQdx version do you use? You want to get the version 2010.3 since it is the latest version: http://joule.ni.com/nidu/cds/view/p/id/1641/lang/en
The next issue would be that the Ethernet cameras discover is not necessary and that it is only used for GigE Vision cameras. The VI was named before IP camera support has been added and the name is unfortunately confusing now. In any case, the discovery of cameras takes place in the background and is automatic. The VI list must list your camera. It may be worth trying just to see if the camera appears in first MAX. Note that the IP camera must be installed on your local subnet, so it can be discovered.
Regarding the examples, virtually none of the IMAQdx examples included in help-> find examples should work.
Eric
-
How to draw a graph with several axis xy enter?
Hello
I have problem in xy graph, the graph xy can only display 1 signal the y-axis of entry (as you can see in the attachment)
Is it possible to draw the graph xy with 2 go? Or maybe there's another type of graph as possible to do?
Note: the x axis must be an entry too (not compared to the time / sample).
Answers and advice are welcome.

Best regards
Alvin Chandra
You ask for a second scale of Y on the graph?
If so, right-click on the scale of the existing, select "Double ladder". This will create a second scale. You can then (if you wish), right-click on the new scale a select 'Swap sides' to put it on the other side of the chart.
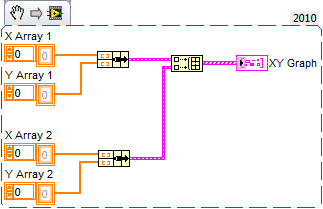
You ask about adding a second plot?
If Yes, then you must group your arrays of X and Y points in clusters and build those in a table:
The x-axis is always an entry on the XY graph. You just need to change the title of the axis. Way easier to do is to double-click the axis title and type the new name.
Rob
-
Word graphic value Font.vi how can you Format axis numbers?
Hello
I need assistance with formatting of the AXIS on a chart in Word using Labview. In my situation, I have reading data like this:
0,0033
0.0003
0,0203
Etc...
I need FOUR decimal places to display correctly the numbers.
When I run through Labview and Word... All I get is ZEROS through my axis.

If I double click on the AXIS (in Word) and go to the properties of the "Number" tab and CHANGE 'General' to 'NUMBER' and define the "third DECIMAL' to '4 '.
The graph looks EXACTLY as I want it to look:

After the manual settings are applied:

After you apply the Word AXIS settings manually is formatted perfect! I have 4 decimal places correct points for my data.
NOW, the Question...
How to use the "Set Word chart Font.vi" for formatting the axis with four decimals?
I tried the combination of countless, and I can't seem to make it work. I even called Tech OR supported and they have a little "shrugged" their shoulders and referred me to a file 'help '.
I may have this wrong approach, but my goal is to use a 'model Word' and "To generate a report of Doc Word" without going through the user for formatting the chart MANUALLY.
Here's a sample of what, in my view, have to work... but I can't seem to find a combination of work.

Looking for suggestions! Let me know what you think and I'll give it a try!
Thank you very much!
Doug
I thought about it!
The help file "Word Set Graph Font.vi ' is not too useful. But I found the combination that works!

Here is the example code that worked:

What is difficult about the file "help":
"(general) number format. For me, I thought he was referring to categories of Word... THAT IS... General, number, currency, etc.
"(general) number format" really means "Mask number format". I replaced that with the type of mask, I tried '0.0000'
'type (category) axis' still once, confuse another title. The names of properties of word 'general, number, currency... etc.' as a 'category '.
I tried all the combinations (3) using a 'constant'... but the use of these has caused the problem! I REMOVED the entry for the vi!
"index graph (-1)" once again the help file is missing explanation. But it gives a little trick.
This refers to the order of the graphic objects in your Word document. In my model, I got the following:
0 = header graphic
1 = histogram one.
2 = two histogram.
I changed the graphic index to 2.
I literally worked on this problem for days! No sooner, I'll post my problems, I thought about it.
Doug
-
terminals connected to various types
Hello
This error
but they are the same two data type?
_____________________________________________________
These can be wired together as their data types (digital, string, array, cluster, etc.) do not match. View the contextual help window to find out what type of data is required.
The source type is table 1 d of
cluster 1 element.
The sink type is table 1 d of
cluster 1 element._____________________________________________________
Why is this?
Basically, I want to make a xy graph,
1 signal either the x axis and 3 others plotted on axis y
any help is appreciated
VI attached
Thank you
Daniel
Then you need to build the array
-
the control is not of the type expected by the function.
Hello!!
I'm creating a 3-d chart with the library CW 6.0 3D graph.
I would not have a graph autoplot... and I'm looking how to... How can I put my values on the axis?
I tried with SetAxisScalingMode, but it does not work... I got the error: the control is not of the type expected by the function.
Thank you
Adeline
SetAxisScalingMode is intended for standard user interface graphics, that 3D graphics CW isn't. This ActiveX control has a completely different programming interface and the integration of 3DGrpahCtrl.fp in the project. The instrument driver provides all functions related to the chart control 3d. You can set axes scales for example with CW3DGraphLib_CWAxis3DSetMinMax)
Maybe you are looking for
-
I am looking for a cord that connects the port of lightning in the auxiliary port of a car. Someone know if Apple makes this cable or will be an entry? 3.5 mm adapter Lightning has terrible sound quality.
-
NB200 - Recovery Media Creator and drive HARD USB
I just bought a white NB200 and noticed that it does not come with a DVD of Windows 7 in case I ever need to install.I was informed by the seller in the store I could save a copy on a USB key using a recovery disc writing.I assume that "Recovery Medi
-
DisplayPort to DVI adapter is generic Non - PNP monitor
I have a 6 week old want H8 - 1420 T C1U69AV #ABA, Windows 8 64 bit, 1 GB Radeon HD7670 and I am trying to connect two Dell 1905FP monitors. Each monitor works fine when it is connected to the DVI port. When I connect a monitor with an adapter HP Dis
-
TouchSmart 610-1280qd; Windows 7 Pro; PC x 64; Intel Core i7-2600cpu@340GHz; connected to the second monitor (HP2711x) via a video adapter - Startech.com (provided by HP): Crashes (buzz then blue screen) when I play movies, videos. All solutions?
-
try to uninstall programs, "Journal of instalation not found".
I would be very gratful if someone could help me... once again please! Yesterday, after the acquisition of the programe of thugs 'CYBERSECURITY' I came here asking if someone could help me to get rid of it, thanks to those who responded, unbelivably,