Generation of sinusoid frequency accurate FPGA
Hello everyone,
I have a myRIO and I want to build a lock in the amplifier. To this effect, I need excite (in fact the driver laser) laser with a certain frequency, in a case 32754 + to 1 Hz. This signal must be a square wave. I need a sine and a cosine with the excact same frequency that I use to turn on the laser. But the sine and cosine do not have to be sent outside the FPGA through a port analog or digital.
To summarize, I have need of a square wave, sine and cosine with excactly the same frequency. Only the square wave is sent through an analog port. (I use the "square wave generation.vi")
This works very well for example 4212 Hz. But 32754Hz can't be represented pretty good by a 40 MHz clock (a lot of jitter). To this effect, I thought to use a Schmitt Trigger.
Finally I come to the point! I use the "generator.vi of sine wave' on the FPGA.
Can I output a sine wave signal with any frequency I want to use this VI, if right of Nyquist is hurt? As this VI uses DDS I think that Yes, can anyone confirm this?
I only ask, because the sine wave will be converted into a square by the schmitt trigger signal and should always have the same frequency that it represents in the FPGA.
Kind regards
Slev1n
Slev1n wrote:
Hey, JLewis,.
1, how can I calculate/derive the resolution?
2, the size of the LUT or also the resolution of the amplitude of the a influence on the resolution of frequency?
1. the resolution only depends on the accumulator and clock rate, e.g. 40 MHz / 2 ^ 32. The rate of the clock increases the resolution of the average frequency of DDS, but will negatively affect the jitter due to the clock period. In your case, it seems that you are more interested in the resolution of frequencies without jitter, which are those for which the clock frequency is an integer multiple of the frequency, for example freq * k = 40 MHz. You can play games with clocks derived from hitting a specific frequency, but in general most of the frequencies will be free of jitter.
2. the other settings do not affect the resolution, but affect the phase noise and/or quantification. For your application, I expect that phase noise is the biggest problem and is affected by the LUT, the interpolation option size and samples/cycle (IE, the rate of the loop). Quantization noise is affected by the output data type and amplitude (otherwise the range). You will get a filtering via the D/A conversion and the Schmitt trigger, so it is difficult to predict how much of a concern these parameters will be for you.
You can see the Xilinx DDS generator (on the pallets of Xilinx IP integration). He has a few more options as the dithering phase and a 48-bit accumulator. On the theory and the effects of various parameters of their documentation is excellent: http://www.xilinx.com/support/documentation/ip_documentation/dds_compiler/v6_0/pg141-dds-compiler.pd...
I hope this helps!
Tags: NI Software
Similar Questions
-
myRIO sinusoid frequency errors
Hello
I have a big problem when generating a sinusoidal signal. I use core FPGA with an Express VI to generate the sinusoidal signal and tuned frequency is not the same result when I measured with an oscilloscope. For example, at 100 Hz out 119Hz; to 1000 Hz is released 1200Hz and 5000Hz was released 5800Hz.
Please I need help as soon as possible for my graduate studies.
the entrance to the generator sine takes a + 32.0. your code did not provide the full 32 bits, and the result was no frequency of course.
I have attached a version update. This should work much better. as I have noted in VI, I do not generally the calculation of the increase of the FPGA code generation. This calculation is usually in floating-point in RT code. But if you need it in FPGA, then, it's a way to do.
-
generation of reports for the FPGA VI
Hello..
I want to include the number of resources used by FPGA (LUTs, slices, blockrams etc) in my report generation.
Time the build completed, a window showing these resources will occur. But, how can I add this report compilation in my generation of report...
Please let me know...
Thank you
Prashanth
Hi Julie
One idea would be to copy the data from the device file Utilization Summary in your report. See this KB for more information and an example of the layout of the file (which is quite complex, sorry) the path in the KB guess you LV FPGA 8.5, if you for example LV 2009 would be the path:
NIFPGA2009\srvrTmp\localhost\
\toplevel_gen_xst.log C:\. It must be remembered that this file only contains information on the latest compilation so you will only be able to get the info from this compilation, but that should be enough, if I understand your intent.
Best regards
David
NISW
-
generation of sinusoidal wave with smu
Is it possible to generate, for example, one 3 a 50 Hz sine wave with SMU 4138 or 4139?
THX
The DCPower API provides no screws to use blocks of power or SME like FGENs. However, it is possible to program the jury at the exit of the standard functions by translating the desired frequency and amplitude to a sequence of continuous output with delays of source is defined so that the output function the user selects is output on the terminals of the device.
The attached program allows you to use a NI 414 x, NI 4135/4136/4137/4138/4139 as a FGEN. As it is, the program is limited to a maximum output frequency of 5 kHz.
I have attached a version of the code for the current output and a version for output voltage waveforms.
-
generation of multiple frequency continuous impulses
Hello
I have a request I want to control the entry of a multiplexer. The multiplexer has six lines of address, and as I do sequential addressing the frequencies of addressing signal lines must be divided by two, as f_in, f_in/2, f_in/4, f_in/8, f_in/16 and f_in/32.
I saw in the community using "CO Pulse Ticks" is it possible to divide the input by N frequency, but this is done only for a counter / OnBoardClock (s) and I can not generate signals divided many.
As I use SMU-6358, I thought cascading counters and out somehow divided frequencies.
Is there an effective way to make such a request?
Kriváň
Hi Kriváň,
There are only 4 meters on the 6358 that divide-down approach probably isn't going to work out.
This problem is acutally surprisingly easy if you use instead of the digital output lines to generate your signal. They can be clocked up to 10 MHz on the PCIe-6358. Here is a simple example of what the code would look like in LabVIEW to review all the 64 combinations of your MUX in sequential order:
I hope this helps!
Best regards
-
FPGA wave sinusoidal generation discontinuity
Hi all
I have a question about the generation of sinusoidal waveform FPGA: the generated waveform has unknown non-periodic discontinuity. I want to know where it was generated and how to solve it.
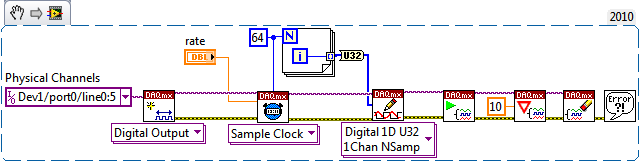
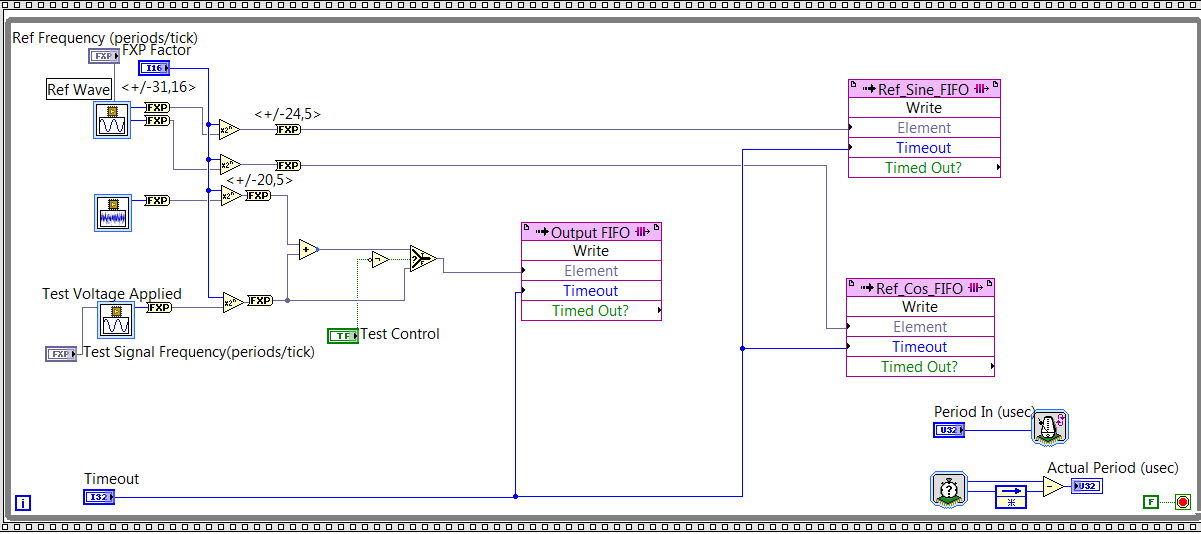
As you can see on my FPGA code below, I generated reference signal - a wave of fishing and a cos wave by using the function of 'generation of the sine wave. Then I write the data to their corresponding FIFO and the sampling rate is controlled by "Period In (usec)" and it is set at 20. Thus, the sampling rate is 50KS/s.
Fig. 1. Code generation of FPGA sin wave
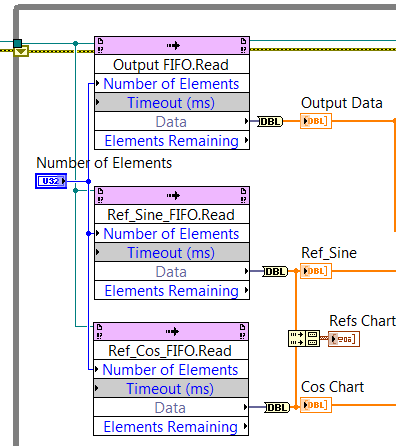
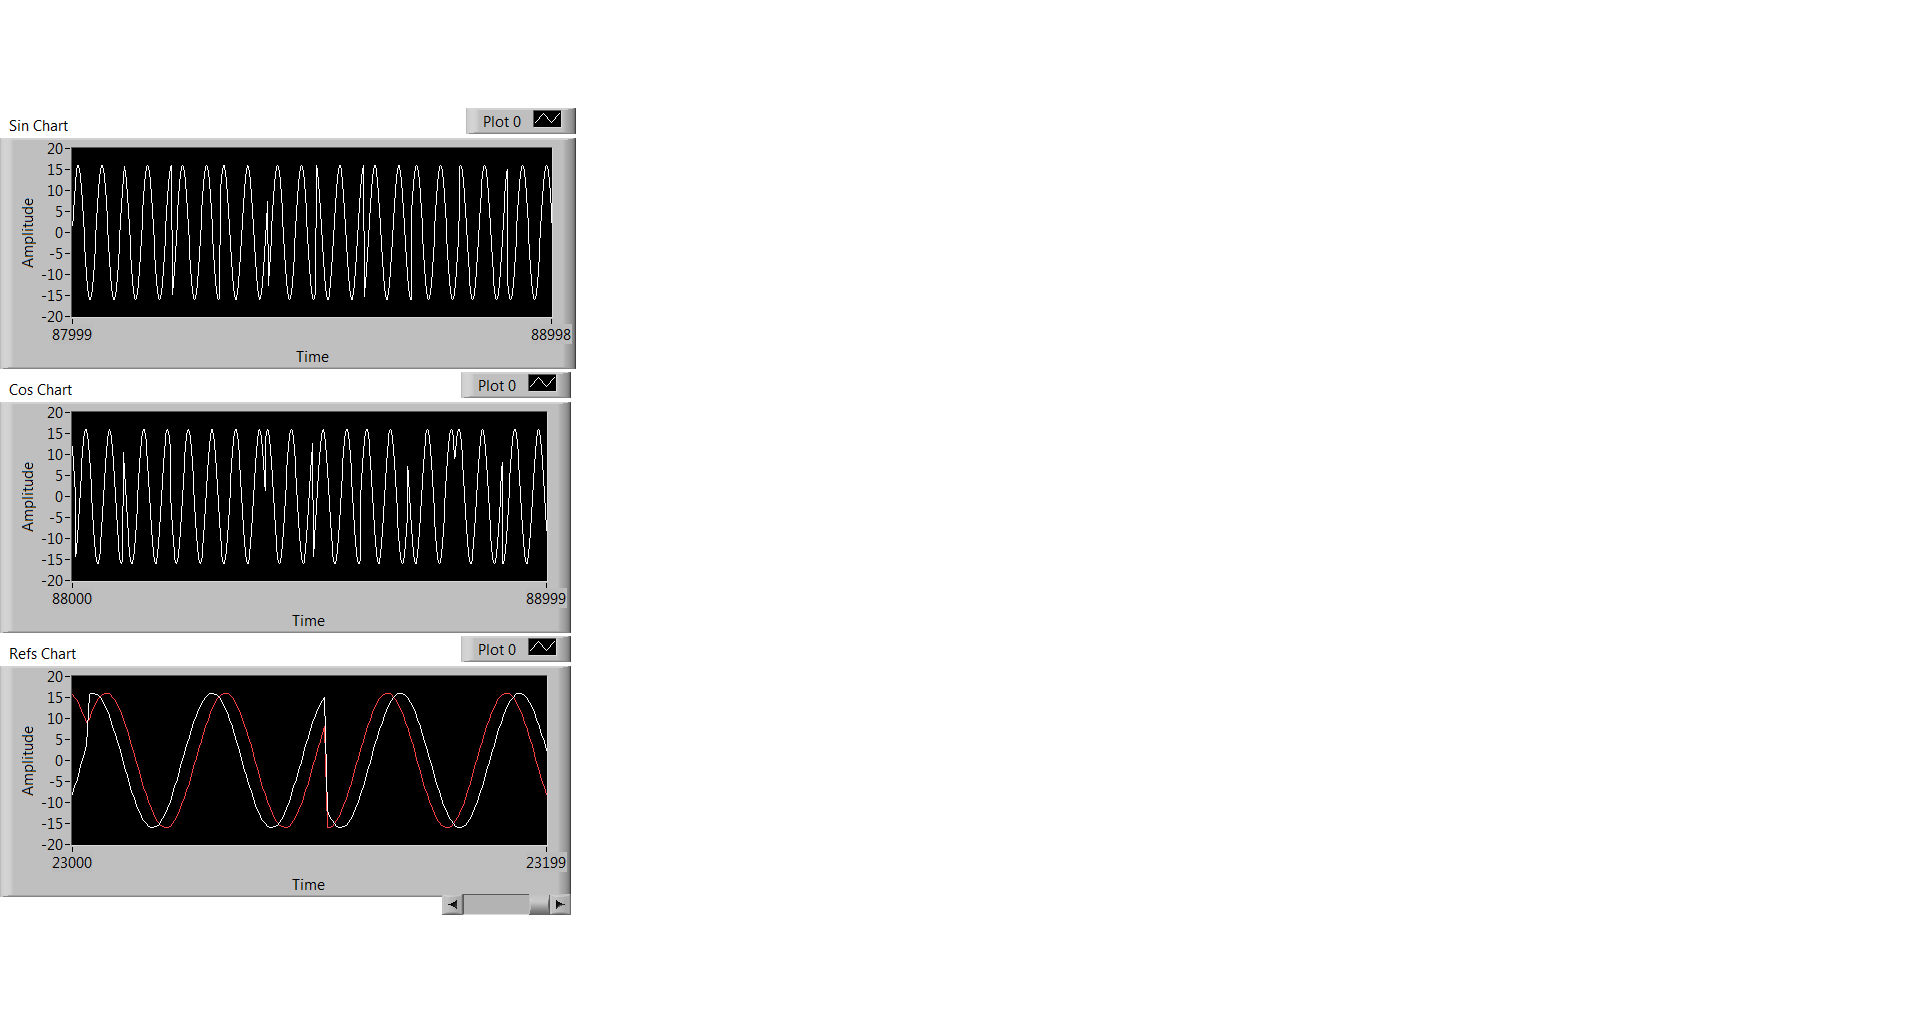
At the level of the RT, I observe the data through the code illustrated in Fig. 2, and what I observe is Fig. 3. Three graphics from top to bottem are: result of the sine, cosine wave result, sin / cos wave shown using the same chart.
Fig. 2 RT level Code
Fig. 3 Sin / Cos waves are the result
Everyone has the same problem ever or any input on what has caused this?
Thank you!
Kind regards
Doris
Hello
Thanks for responding! I think I solved this problem. What's happened is that the execution time for the rest of my code of RT level is longer than the duration for the FIFO to be filled, so the code FPGA that writes data in the FIFO to wait to get code RT to finish. FIFO data are not time continues because of this reason.
Kind regards
Doris
-
Sine, square and Sawtooth generation of sweep with variable duty cycle/rise time & descent
Dear all!
I ask and need some frank advice on the question of the subject counts with the following note:
(1) I am a novice in LabView.
(2) I graduated in electronic engineering average who graduated about 9 years ago and since then I have not been involved in electronic engineering.
I have undertaken a task or the generation of sinusoidal waveforms, Square and sawtooth. All these signals must be swept frequency form 1 Hz to 100 kHz. The amplitude of these waveforms should be able to be adjusted. The Square Wave cycle should also be adjustable (or better to be able to be scanned). Similarly the rise time and the fall of saw teeth time should also be adjustable (or better to be able to be scanned).
Is considering other options as well, I want to try it on LabView.
I would like to ask that is it possible to perform this task in Labview 7.0? If possible given the para 1 & 2 above, is it possible for me to finish this task in 15-20 days if I work on it for about 3 hours a day? If this isn't the case, then that may be a reasonable estimate?
I'll be very grateful if you people can offer advice on the whole project or part of it.
Thanking you in advance and requires urgent response (s).
If you have less than the full version of LabVIEW, you have defined functions of generation of waveforms. They can be used to generate the signals of Zack with the NI DAQ board. An experienced programmer may be able to write the program in as little as 3 hours in total. How long it wouldw take you is going to be a little higher but depends on how long you are willing to invest in learning the basics of everything first.
-
Hello world
I'm sorry if the question may seem stupid, but how can I draw the sinusoidal frequencies on the x-axis and the corresponding amplitude on the y-axis after that I could achieve fourier transformation?
Thank you very much in advance for any advice.
Andrea
Use a graph of a waveform.
I'm assuming that your FFT gave you a data table, a F0 and a dF.
-
Why labview programmers use 10.1 the default frequency instead of a same 10.0 Hz?
It was an issue that was raised during the lab class and no one has an answer for. Any ideas?
I call it the wagon wheel effect.
In the old westerns, whenever a wagon with a Ferris wheel to rays rode by the camera, sometimes the wheel would look like it rolls slowly forward, sometimes slowly propagated backwards, sometimes it would look as if it was stopped.
It is a function of the frame rate of the camera over the period of the cycle of the spokes of the wheel. If we spoke (or more) offers exactly the right distance between a frame of the movie and the next, it would look like the wheel had not moved at all. If he moved a little further than the distance from rotation of we talked, it would look like it rolls slowly forward. If the cart is a little slower, then it would move only less than the distance of a spoke and he would look like the wheel rolls backward.
Same thing with having a periodic waveform (every bump of the sine wave is a spoke of the wheel) and a number of acquisition of samples and data rate equal to a whole number of this period (essentially the frame rate of the camera.) Wagon wheel always rolls forward. The sine wave is still oscillating. But according to the rate of acquisition compared to the wave sinusoidal frequency gives a different appearance to the appearance of this sine wave on the chart.
Experiment and give it a 9.9 Hz sinusoid, you will see that it seems to move backward.
So I think (and this is only a guess) is that whoever designed the express VI gave it a default value of 10.1 Hz to visually simulate on the graph of the sine wave motion.
It doesn't really matter what they chose by default as it is to you that the programmer LabVIEW to change this default setting (whether in the express VI or the wiring in a value) to something that makes sense for your application.
-
Multi-multifunction-Synch rate HAVE AO
Hi all
I'm new to Labview and these tips.
I work through the AI Multi-multifunction-Synch-AO example as found for example NI Finder and I was wondering what difference between it the "rate of generation of update" output "Sample clock" and the sampling rate is on in the "sample information" of the "core generator.
My first thought was that first of all, a control material and a second control of the software, but I find that when the two are adjusted against each other, my changes of sinusoidal frequency, even when the frequency parameter is left unchanged.
Thanks in advance.
Hi currentenglish,
Generation of update rate attached to the "sample clock" indicates the rate at which the jury will clock samples.
The "sample information" is used by the software to generate a waveform appropriate considering the rate of the material. If there is an incompatibility between these two values, you will have a different frequency than you expected. For example, if you generate the waveform into thinking that the sample clock is 1 kHz, but it's really only 500 Hz, the generated waveform will be half the frequency you specify.
You should connect the rate of generation of update in the sampling information to ensure that they are always the same. I'm actually a little surprised that this example of shipping is already this.
Best regards
-
Driver or Toolbox component missing daqmx.rc
I'm trying to open a VI works fine on another PC. At the end of loading, pop ups window "Load and Save WARNING list":
Type of warning - missing driver or component Toolbox
Details - C:\Program NIUninstaller Instruments\LabVIEW 2011\vi.lib\DAQmx\create\channels.lib\DAQmx Create Channel (CO-Generation-the pulse frequency) .vi (DAQmx create channel (Co-generation - the pulse frequency) .vi) this VI is in need of a driver or Toolbox component which is not found. Missing file of the resource 'daqmx.rc '.
-----------
The file daqmx.rc exists to
C:\Program NIUninstaller Instruments\LabVIEW 2011\resource\objmgr
I took the following measures:
1. uninstall all previous versions of LabVIEW, LabVIEW 2011 to leave.
2. has tried to run a repair on LabVIEW 2011 - who do not recognize the DVD provided by the plant as a source of distribution.
3. uninstalled and reinstalled DAQmx 9.3.4
No generation of pulses being applied anywhere in the VI of interest, can I safely ignore this warning?
What, exactly, the warning means? The mentioned file is, of course, where it should be.
Any help would be appreciated.
Hi mistercat,
It seems that this is due to a problem during the installation (it may sometimes arise when things are not installed in the correct order). I would recommend uninstalling DAQmx and LabVIEW 2011, reinstall LabVIEW for your DVD distribution and then by installing latest DAQmx 9.4 (the latest version). I'm a little worried that the repair is not recognizing your factory DVD as a source of distribution... You have another computer to try to make sure that nothing has changed for the discs?
Let me know if it helps.
Best,
-
MicroBlaze soft core with Spartan-3F kit
Hello guys,.
Is it possible to implement a Microblaze soft core with kit-LABVIEW FPGA and Spartan-3E? Examples?
In addition, examples of executing a Picoblaze soft-core on Spartan-3E and using LabVIEW FPGA CLIP node kit? Thanks in advance!
This link points to a generation on the Virtex 5 FPGA platform. In principle, the process is the same for Spartan...
-
50mV peak output of sine similar, f = 10 kHz
Hello!
Yesterday, I found that when I create an output signal sinusoidal similar (with a program labview or M & a test panel) the sinus has a 50mV peak when it changes sign (+/-)
I use a USB-6212
LabVIEW 8.6
example of frequency: 200kS/s
sinusoidal frequency: 10 kHz
The peak is always there to 1000 Hz (stil 50mV), but I do not see for the frequency of 10 Hz.
The advanced amlitude does not change for the Amplitudes between 1V to 10 mV.
I see the same glich on AO-0 and AO-1, and it's always when the sinuses = zero.
You know: ' what is it?"and the most important: what can we do about it?
I have attached a picture of the vertices for a sinus with amplitude 10mV.
Application of a filter to exit the peak would be my last resort, but this does not seem like the way to go.
Thank you very much
Higgins
This glitch (epi) is typycal for some (simple) CAD models. A simple RC filter can help. Bonny Baker wrote that an article in EDN to this topic and an article on this topic or is also to ni.com somwhere...
-
Align the two signals and measure the Phase Shift
Hello
I do an experiment in which I use the NI USB-6221 DAQ card. The jury is able to make 250 k samples/second. I want to measure two voltages in a circuit and find the phase shift between them at frequencies between 1 and 10000. First I ouputted a wave sinusoidal frequency variable through the Commission and applied to a test circuit. Then I used the Board to measure the two tensions consecutively (thus reducing the maximum sampling frequency at 125 k). I used the signals align VI and measured the two phases and then calculates the phase shift (VI attached in Phase 1). It worked well for the test circuit I built in which the phase shift went way logarithmique.20 degrees ~84.5 degrees and then stabilized. At frequencies above 5 000 Hz phase shift must have remained constant, but it varies more or less 1 degree. When the phase shift is 84.5 degrees, present a degree of variability is not particularly explicit. When I asked my program on the circuit that I really wanted to measure, the phase shift went from-. 5 degrees up to about 1.2 degrees. The change in the values of phase shift at high frequencies (> 3000) was environ.2 degrees. Given the small phase shift, this variation is unacceptable. Now I tried to use a sequence to each blood individually (increase the maximum sampling frequency to 250 k) and then align the two signals and measure the phase of each shift. When I use align it and re - sample Express VI to realign the two signals, I get the message "error 20333 analysis: cannot align two waveforms with dt even if their samples are not clocked in phase." Is it possible to align two signals I describe here? I enclose the new VI as Phase 2
Matthew,
I think I have an idea for at least part of the problem.
I took your program data and deleted stuff DAQ. I have converted the Signal on the chart control and looked then what was going on with the signal analysis.
The output of the Waveforms.vi line has two waveforms, like the entry. However, arrays of Y in the two waveforms are empty! It does not generate an error. After some head scratching, reading the help files and try things out, that's what I think is happening: the time t0 two input signals are 1,031 seconds apart. Since the wavefoms contains 1,000 seconds of data, there is no overlap and may not align them.
I changed the t0 on two waveforms are the same, and it lines up. The number of items in the tables is reduced by one. Then I increased the t0 of 0.1 seconds on the first element. The output had both greater than the entry by dt t0 t0 and the size of the arrays was 224998. Reversing the t0 two elements shifts the phase in the opposite direction.
What that tells me, is that you can not reliably align two waveforms which do not overlap.
I suggest that you go to 2-channel data acquisition and that it accept the reduced sample rate. You won't get the resolution you want, but you should be able to tell if something important happens.
You may be able to improve the equivalent resolution by taking multiple steps with a slight phase shift. This is similar to the way that old oscilloscopes of sampling (analog) worked. Take a series of measures with the signal you are currently using. The make enough average to minimize changes due to noise. Then pass the phase of the signal of excitement to an amount that is smaller than the resolution of phase of sampling rate and repeat the measurements. Recall that I calculated that for a 5 kHz signal sampled at 125kHz, you get a sample every 14.4 degrees. If shift you the phase of 1 degree (to the point/mathematical simulation), you get a different set of samples for excitement. They are always separated by 14.4 degrees. Take another series of measures. Transfer phase another degree and repeat. As long as your sampling clocks are stable enough so that frequency does not drift significantly (and it shouldn't with your equipment), you should be able to get near resolution of what you need. The trade-off is that you need to perform more measurements and may need to keep track of the phase shifts between the various measures.
Lynn
-
Voltage offset problems with the NO-9401 for PWM signal output
I try to create a 20 kHz PWM signal to drive a motor control circuit uses the NI 9401 module in the chassis OR cRIO-9073. Generating the PWM signal works. For some reason, changes in shift of power as the market factor is increased. It is less effective for the engine, as you can imagine.
The code I am using is the finder of the example, for the generation of PWM on an FPGA and is attached.
I thought that it worked before but may have used the the NOR-9505 rather PWM output to test my circuit. It would be unreasonable for me to do this as a permanent solution.
The problem can be summed up as: with an increase in the liability of the cycle the voltage line (offset) movement of the output signal in the negative (according to ADGE) Basic or down. The Vpp signal is correct and does not change. Against ticks from 0 to the maximum of 2000 ticks (duty cycle IN), the offset voltage shift is such that 100% the level of full voltage is 0V.
Any ideas as to why this offset voltage shift that happens?
Do not be dismayed, I worked on the problem. There was a connection problem - I thought I was logged in as reference Earth, but it has not been properly clipped.
Maybe you are looking for
-
The tabs are open not together
I recently got a new Windows 7 laptop and decided to use Firefox Sync to move everything related Firefox above. I think that all this, and I'll go through later do not forget to add my Greasemonkey scripts and elegant. Everything was going well... un
-
AT100 - after ICS upgraded the Swype App keyboard does not load
Just upgrade my AT100 at ICS.Everything seemed OK until I have to enter text, and then got an error message indicating "open English WE failed." Changed to the Android keyboard and that works fine, but prefer to use Swype.Any suggestions? John
-
Problems of excessive noise and fan performance.
(I found a few similar posts, none seem to have any kind of resolution. I already submitted details to the comments for OS - X and MacBook Pro, because I know that Apple doesn't really care these forums.) I'm computer LITERATE in a company with more
-
How do you on what OS a key embedded BIOS is for?
So the hard drive died, I got a new, but the stupid computer came with no COST, so I don't know what version of Windows is supposed to go about it. I know how to check what the product key is embedded (with RW everything), so is there a way to tell w
-
How can I do to make the taskbar allows you to hide every time I have remove the slider from?
2 questions: How can I do to make the taskbar allows you to hide every time I have remove the slider from? This rarely works. Question 2: name of the task SystemSoundsService is called by the Microsoft PlaySoundService class action. What is his fu