Using an algorithm of scaling of the graph of a waveform within a Subvi invisible?
Hello
I have a little problem with the automatic scaling of the graphs.
First of all:
For automatic scaling of the axis LabVIEW uses the set of data that was sent to the curve. If I zoomed in on the inside, the automatic scaling always uses all of the data even if it is not visible at the moment. To resolve this problem, I read on the positions of the zoom sliders and values min/max within this area of research. This method works.
Second:
Now, I want to the scale of the axis using the specified min/max values. Labview graphics using a special algorithm of scaling according to the format of the axis. I want to use it, so my idea was to send the cut data and format of the axis to a Subvi. Inside this Subvi, I use a waveformgraph to display the cut data and run an automatic scaling once. Now, I read the values min/max of the graph and set this values on the main chart, I see in my program.
The result is, my main chart shows the data zoomed area in maximum size (to the axis scale) and hole data is always available, so I can still pass the data in the chart or others.
Problem: The sense of scale with a grpah inside a Subvi only works if the chart inside the Subvi is visible. If it isn't, no scaling would be made. My solution is to open the Subvi as a small window and close automatically after the scaling. It's not very nice.
Are there any other ideas how to use auto scaling without showing the front of the Subvi?
Thank you very much and best regards,
Michael
Hi Michael,
-show your façade out of the visible screen area, so the user does not notice the window...
-Make your own algorithm of scaling based on these values min/max...
Tags: NI Software
Similar Questions
-
Control the properties of the graph of a waveform for waveform table.
I'm to customize a waveform graph. I will have no problem using nodes property to define all the things I need to (color plot, the names of axes, etc...). My wave form is actually an array that contains the seven waveforms. The problem is that the property of the waveform graph node changes only trace, legend, etc. the first signal in the graph. They all have the chart perfectly together. However, my application requires the user to be able to select say signals 2, 5 and 7 of the table. When it does, it receives signals of 2, 5 and 7 on the chart, but the legend Watch reports 1, 2 and 3 and they draw in the colours of the signals 1, 2 and 3. Any suggestions on the update of the properties of several plots of a waveform graph?
Also when I want 1 signal trace a curve of waveform. When I want the signals from 2 to 7, I have to draw a second copy of the curve of waveform. For some reason any a waveform table chart cannot double as a unique waveform graph. Any ideas on that? Thanks in advance for your help.
To change the properties of other signals in the chart, you will need to set the ActivePlot property node before writing the color, the name of legend, etc... To display only the selected signals, you could do a couple different things.
(1) set the color of the signals that are not visible by transparency
(2) write NaN values to the curve of waveform of the signal that you do not want to display
-
Dynamically hiding / display the curves on the graph of a waveform
Hello
Is it possible for IT (OFF) dynamically a particular curve on the waveform table.
Here is the example below - 3 curves are superimposed and to see a particular curve, it would be nice to have one option on OFF other curves (e.g. using checkbox).
Thanks in adavnce.
Pavel
It's actually a built-in function.
Right click on the legend to draw. Select the visible items > trace visibility box.
-
Visualization of more values on the graph of the DAQ card
Hello
I acquire a Signal using the data acquisition card, the problem is that I can view only a few values on the graph of a waveform. Guide kindly of me if I want to see the points more on the graphical waveform, what I would do in my programming window.
Concerning
I think that you just want to use a TABLE instead of a chart. A graph has an associated history, so that it shows more that just the last data series acquired you and wrote to the curve.
-
dispplaying data on the graph of waveform inside/outside while loop
I create a vi using the random number generator, entering the number in the function(express>>arithmateic>>maths>>trig>>sine) fishing and connect the output of the function sine waveforms. Table of waveform show no problem. If I replace the with graphic waveform table, I get an error that the source type is differenct type of sink. I then put waveform chart outside loop everything hoping that tunnel would act as a table, but still I get the same error. I then put build table palette between all border and loop waveform graph which is placed outside the while loop. I get no error, but no data is displayed on the graph of a waveform. Theoretically, if I press stop I would see a distorted sine wave on the waveform graph, but this doesn't seem to be the case. I am wondering how to view data on the graph of a waveform in such cases!
Thank you in advance for reading and help!
See you soon
First of all, you can take a part of the basis of LabVIEW tutorials.
Since you need to work with a chart and it is the preferred method to display data point by point, I don't know why you try to use a chart. In any case, you cannot use all simply a table of generation because that would be just the result of the last iteration and your graph indicates it is a single point. If you activate autoindexing, then you get all the values, but not before the end of the loop. If you were to use a shift register and the build dashboard, you might place the graphic inside the loop, but then you would face performance issues that the table would grow uncontrollably.
-
How to use the graph of the intensity in the iPad data dashboard.
Hello
I use a graph of intensity in my vi main under a project of myRIO.
I created a shared variable of the 2D array. When I selected the variable in the ipad it does not show that he presents in the pc...
I want to mention that I have selected the multiplier as (= 30/255) 0.117647 in labview in pc
I use the version of labview 2015 myRIO.
and I am using iOS 10 in my iPad
can someone help me please
Hi adil,.
The graph of the intensity is not supported in the dashboard of data.
Kind regards
Denny
AE Singapore
-
How can I change the data used by a graph of a waveform depending on which tab is active?
Hello
First of all, I want to say thank you in advance! Let me describe the situation a bit. My front panel VI (see attachment) has a tab control and on each tab of the window, I have a graph of intensity with a free drag cursor. On the tab control window that I try to display the row or column of data where the cursor is, I can do this for each in the intensity chart individually. I'm trying to clean up the block diagram a bit and instead of using 4 waveform graphs, I want to use one, can the data that is displayed in the graph of the waveform are associated with which page is active in the tab control. Is this possible? And how can I do?
Thank you once again,
~ Daniel DeWitte
Thread just the terminal tab to a case structure, switching data going graphic terminal
(Sorry, message by phone, can not look at your code...)
-
How to trace the temperature and voltage using the graph of Mixed Signal
Hello
I use the NOR cDAQ-9178, module NI 9214 (temperature) and the module NI 9201 (voltage). My program allows the user to choose among 3 different tasks, Masurement of temperature, voltage, or both. When you select the task for temperature and voltage measurement, I was drawing all channels on the same graph. I was invited to separate channels of temperature and voltage and draw on a split graph, using the same category axis. I tried stacking, but could not control where each parcel channel went. I think the Mixed Signal graph would work well. Everything works and records all the data of the channels to the files, but my plots appear not on the graph, although I can see the change in scale numbers. I think I can use the cluster incorrectly. Can someone tell me what I am doing wrong? I selected the 'Plot Visible' option, but the plot is not always displayed. I've attached a zip with all the screws needed to run my program. The main VI is "Voltage_Temperature_SingleTask_Measurements_MAIN.vi"... but everything must be downloaded to the program works. Please help... Thank you.

Hi mzhlb,
I complained only the expressVIs.
Why not use simple IndexArray function to get bots waveforms of your waveform table? (I faked it your DAQmxRead with functions SigGen).
-
Plot the graph of origin using Labview
Hellou,
I try to plot the graph of origin using Labview. In Labview I connect and create the new model of origin for instance. Template file (.) OPJ) was created before. End of data in the worksheet then I plot the graph of origin. But I can't use OA_NewEmptyGraph.vi because it is to create a new chart. I'm trying to graph in graph model.
In labview that I found for OA_FindWorksheet.vi sheets, it's journal to find, but a cant find, a few "OA_FindGraph.vi" is - it is or made elsewhere?
Thank you
Norbert
Hi Norbert,.
your question seems to be linked to LabVIEW, while you're wrong he posted in the forum of LabWindows/CVI.
-
Need help to print a logo on several pages using the ^ graph of order
Hello.
I'm using Adobe Output Designer 5.7 (formerly Jet Forms).
Our logo was incorporated originally in about 100 forms of Jet (*.) Files of the IFD). There was the ability to print multiple logos of the same *. File of the IFD.
I found that I could use the ^ graph command. But the logo only print on the first page. In the. * IFD file it is 60 pages/subforms. Page 1 contains the data header and footer of page 1. Page 2 contains the data header and footer that are used on Pages 2 - N.
I'm passing to JetForms SAP data.
I tried several options, but it is impossible that it works correctly.
The full path and the name of the logo is stored in the variable & T_LOGO_FILENAME &.
Here's what I tried to do and results information.
Attempt 1)
^ COMPANY_LOGO FIELD
↑ GRAPH & T_LOGO_FILENAME &
This displays the logo on the first page. It print the logo where the COMPANY_LOGO field appears in JetForms.
The first page seems perfect.
The problem is that no logo appears on page 2.
Attempt 2)
GLOBAL COMPANY_LOGO ↑
↑ GRAPH & T_LOGO_FILENAME &
Logo print in the middle of Page 1. It does not print when the COMPANY_LOGO is located in JetForms.
No logo prints on Page 2.
Attempt 3)
↑ GRAPH
& T_LOGO_FILENAME &
This displays the name of the file in the middle of the first page.
Attempt 4)
GLOBAL COMPANY_LOGO ↑
Michelle tests
The text "Michelle Testing" appear on Page 1 and Page 2 in the correct position on the screen. It prints where the COMPANY_LOGO field is in the form of Jet.
We will need to add or change logos periodically. We are now looking for dynamically pass the name of the file to JetForms, so that we have no need to edit and compile 100 *. Files in IDF every time a new logo is added.
Any suggestions or recommendations?
Thank you
MichelleSOLUTION
I need to set the type to "Graphics" in the form of Jet. (The type was originally 'Text').
The code is SAP looks like:
^ COMPANY_LOGO FIELD
& T_LOGO_FILENAME &
The result is perfect now. Logo print in the right position on each page.
-
Odd spike in the graph of the position when using facilitated easier?
Hello all-
I encounter this problem recently and can't seem to find a solution (TBH don't know exactly how you get it either).
Creating two keyframes for position of a layer, even when the thing is moving in a straight line with no other keyframes, I get this weird effect where the layer of sort of "wanders" out of the way before arriving at its final destination. When I open the graph editor for post curve looks like this:

I want a smooth curve between the two keyframes, or a straight line, but rather boost MI get which is odd. This continues to has and I can not find a coherent reason and its driving me crazy
Thank you very much for your help!
The default spatial interpretation gives the energy of movement. Sometimes when you set or move there is a small delay and you get a little pingpong or unexpected because of the energy in the movement movement when the position is changed by a keyframe. If you zoom in and look in the path, you can see which overlap the Bezier handles on the path. This problem is extremely difficult to fix in the graphics editor by dragging the autour values. When you set the default linear spatial interpretation this energy with all its vectors is removed, so you get straight lines between points. This can work very well for your entertainment, but most of the things I design works best with energy and curves.
If you have a problem like this example and you need to maintain a curve and want to smooth movement, it is generally easier to start in the Composition Panel by examining the path and use the tool (g) feather and modifier keys Alt/Op; ion and Cmnd/Ctrl to set the curve. Take this example:

Correct with the pen tool gives me this:

The other option is to adjust the speed Keyframe or keyframes Interpolation to smooth out the path and movement.

In most cases, if you want a smooth path, then it is better to start with the pen tool in the Composition Panel and then work on schedule. Then you can refine things with the tools of the keyframe. If you need to do a few poles using the graph Editor, it is usually a good idea to have the reference chart (speed in this example) visible and choose Edit Position to the position and the speed of change at the moment.

Because of the energy put into movement along a curved path editing speed or graphics of values can get really confusing. That's why I usually start in the Comp panel.
-
Firefox does not (Cup) of the lower edge and the right edge of the graph. IE10 does not work.
Firefox does not (Cup) of the lower edge and the right edge of the graph. IE10 does not work.
Office Windows 7 2009 service pack 1 Firefox 26 Internet Explorer 10
Flash player version 11.9.900.170 plugin 11.9.900.170 activex version used by FirefoxProblem began late November when Miniclip.com forced updated flash player to version above
-C' was when they started to play a video advertising in the game box before you could start.Have screen shots of IE10 and Firefox26 side-by-side clearly showing the problem - how these can be downloaded for see you? E-mail? Web site? This place seems to be text only?
In the meanwhile the grandchildren and self have learned to use IE10 instead of Firefox that we prefer.
Their House of Windows XP has same Flash Player in Firefox and it works fine.Downloaded two screenshots on Media Gallery.
You can not attach a screenshot in the first row who starts a thread, but you can do it in subsequent responses.
Try disabling hardware acceleration in Firefox (you will need to close and restart Firefox).
- Tools > Options > advanced > General > Browsing: "use hardware acceleration when available.
See also:
Reset the zoom of page on pages that are causing problems.
- View > Zoom > reset (Ctrl + 0 (zero); 0 + Command on Mac)
-
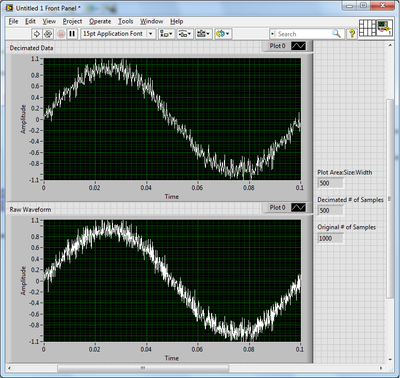
How the graph data are resampled pixels?
A test, I created two identical graphs with land areas 500 pixels wide and a noisy sinusoidal signal of 1000 samples. A chart displays the waveform right, while the other got the results of the use of the function Arrray to decimate to halve the number of samples. They are not the same.
Up to a waveform graph does exactly when it displays a data value larger than its width in pixels?
As you have noticed, the graph is a little more intelligent that you expected. When the number of points exceeds the number of pixels, a form any resampling must take place. A simple decimation as you tried would eventually pass some interesting points. Instead, the outliers receive priority when selecting which points to display. Strong in this way, peaks and dips appear even on a large scale. Reproduce this behavior yourself can be tricky. And once you reduce the data set, the points are gone and zoom is not as effective.
Usually, I try to let the chart to do as much as possible. A simple and effective way to reduce the size of the data you have to ship on the network is to use the SGL precision instead of double precision.
-
To measure the pressure using a pressure transducer that provides the analog current output 4mA-20mA
I wanted to acquire the current analog signal which varies from 4-20mA using NI 9207. I tried in 2 ways.
method 1 - created an input channel current analog & used a reading Vi to acquire it. How can I give the channel connections in this...
method 2 - using NOR-DAQ Assistant, I put the channel connections and I got Amplitude versus time graph. She also gave negative values. Can I do this way which is easier? How can I solve the problem
First attachment belongs to the 1st method
Second attachment belongs to the 2nd method
-
Right-click on the graph that is not possible to select «visible items»
Hello
I have a problem with a graphic. I use the same type of chart in two different projects.
But only in a single project, I can right click on the graph that shows a popup to 'the visible elements' where I can show/hide legend cursor for example.
Is there a mode that prevents right-clicking on the graph?
I can only change visible elements when the program is stopped and not while it is running.
Thanks for help
Or maybe you have unchecked the "allow default run-time contextual menus" in the appearance of window customize?


Maybe you are looking for
-
Satellite X 200 - 1AA - Fn keys stopped working - Vista operating system
The keys Fn on my Toshiba Satellite X 200 - 1AA has stopped working.Operating system is Vista Premium SP1. I Don t know the cause (a Windows Update?). Can someone give me a solution (in addition to using the restore CD)? jmmatos
-
The windows firewall settings 7 HP LaserJet MFP M127fw Pro
Just bought a LaserJet MFP M127fw Pro and having, I think, connection problems. A lot of net traffic, but nothing is ever done. I was wondering if the windows firewall is keeps something. Activation ePrint attempted, but that doesn't seem to do anyth
-
He can't get Windows Defender to work?
Remember - this is a public forum so never post private information such as numbers of mail or telephone! Ideas: You have problems with programs Error messages Recent changes to your computer What you have already tried to solve the problem
-
'Off' blackBerry smartphones appears next to the antenna icon where the bars are usually on 8330
It seems that I somehow function phone off. Although I turned the phone market by using the red button I suddenly the word 'off' in the upper left corner of the screen next to the icon of the antenna instead of the bars indicating signal strength. A
-
STOP AND GIVES PROGRAMS (PROGRAM STOP RESPONDING BACK TO TOP.) WILL BEGIN TO WORK SOMETIMES, SOMETIMES IT FREEZES THE SYSTEM. WERE ALSO TWO WPD FILES VOLUMN DRIVER LOADED, I UNINSTALL THE 2ND ON (THE WHO CANNOT LOAD AND LET THE FIRST (DRIVER WORKING)