voltage comparator
Hello
I'm trying to simulate voltage using Multisim 10 comparator.
I use LM741 (as in "LM741.jpg Circuit"). The output is not limited to V + or V-. Instead, he goes in kilovolt.
Why? Can you explain to me?
Then I replace LM741 with 741 op-amp. The result is as expected.
What is the difference between LM741 and 741?
Thx for help...
The difference is most likely that the model you have selected for the LM741 does not model the power pins, and the output can exceed the power supply for this simplified model. The only model for the 741 models the power pins.
In the dialog box Select a component , there is a Model FOB/ID area, where you can select the model. for the LM741, which is made by National Semiconductor, I recommend that you only select the national model as the manufacturer.
This behavior has really changed in recent versions. In version 10.1 and later, Multisim gives priority to the model by the manufacturer. You can also find how many pins are modeled by clicking the button... View model (model... in 10.0), count the number of pins the. SUBCKT line. For example, in 10.0, for the component LM741AN/833 and model National/LM741_3, the. SUBCKT line is
. SUBCKT LM741_3 1 2 99 50 28
The numbers after LM741_3 are the names of the pins, there are 5. For the same component, but ITI/LM741A model, the. SUBCKT line is
. SUBCKT LM741A 1 2 3
so for this model, only 3 pins are modeled.
Tags: NI Software
Similar Questions
-
Creating a control simple closed loop
Hello world
I need a little help to create a (very) simple closed loop control.
Note: I use 3 boards of Measurement Computing: a USB-2416 and two USB - TC. Measurement Computing with their own driver (called ULx), it might be a little harder to understand than the drivers NOR, but keep in mind ULx is the equivalent of DAQmx.
I need to be out in a binary value 0 or 1 based on measures of input voltage compared to the constants of 4 channels. That is to say. If the measure of tension< 3.5="" (constant),="" send="" a="" boolean="" value="" (see="" a,="" b,="" c,="" d="" in="" attached="" photo)="" which="" in="" turn="" gets="" sent="" to="" the="" ulx="" write="" vi,="" and="" that="" outputs="" the="" binary="" value="" of="" 0="" or="" 1.="" the="" problem="" i've="" run="" into="" is="" that="" i="" need="" to="" "compare"="" single="" chanels="" from="" different="" boards,="" which="" gives="" me="" single="" boolean="" values="" for="" each="" channel.="" the="" ulx="" write="" vi="" only="" accepts="" boolean="" arrays.="" is="" there="" a="" way="" (and="" there="" probably="" is,="" i="" just="" haven't="" been="" able="" to="" find="" it)="" of="" arranging="" these="" lone="" boolean="" values="" into="" a="" boolean="">
(see attachment for what I have so far)
PS. I'm a COMPLETE beginner, only used LV for a week or two, so please explain everything as if I have no idea what's going on.
Thanks in advance!

Hello
the attached example I did should demonstrate what you need to do.
A few things to think about:
1. it seems that the vis ULx return tables of signals. If so, you can select signals with the "index Board" as done in my example. Which consumes less space and does not change the type of the variant signals.
2. If we compare the signals to your constants you will receive Boolean tables because each element of the measured signal is compared to the constant (see my example). You can then decide how to deal with this info - an another Hooray for signals :-)
Concerning
Florian
-
noise of biaxial precision accelerometer
Hello
I do calibration on accelerometer analog biaxial acceleration providing the angle of the sensor measurement.
Based on spec sheet of the analog, the sensor should be in equation linear V = Ka + B
V = output voltage
K = linear sensitivity
a = acceleration of axis
B = polarization voltage.
However, I turn the sensor with a known angle, I get the tension. Draw the graph of the voltage compared to acceleration, I'm not able to obtain a linear curve V = Ka + B, but not linear graph.
How can I determine the non-linear error and the resolution on the graph newly traced in labview? I collected data. and I want to do a regression analysis. How can I do it in labview?
After getting the non-linear regression, how will I know my new model (new equation) improved in error and resolution?
Can anyone help ple
your kindness is much appreciated
Concerning
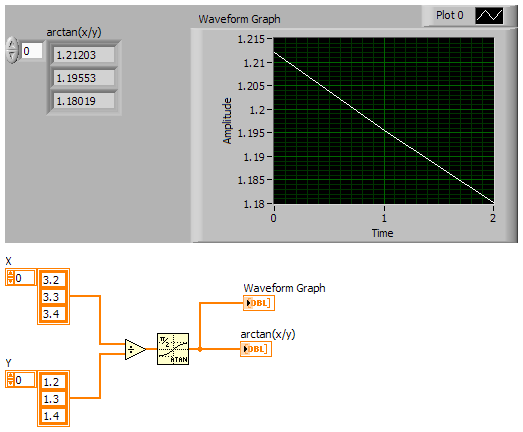
OK, this description makes sense. Probably nothing wrong with your Setup. If you want to create an equation using data points you acquired during the tilt in the X direction and Y? The function Arctan not serve the purpose? Divide all values of all values of Ay Ax and feed the ATAN function table. I used three-point line in the following example, and the output is linear.
-
increase the counter timebase pcie 6259
Hello
Im trying to perform 2 two edge measures 2 TTL signals separation using pcie 6259. I get an error msg 200140 ' 2 active edges consecutive input signals occurred without an edge timebase counter. " Use a faster counter time base. Ive tried to change the basis of counter time through the DAQmx channel nodes but my card is limited to a mx of 80 Mhz.
Are there ways around that?
concerning
Don
Hi the polar bear,
Ive tried steve's idea to generate the PWM and it feeds my ctr and it works fine. If the problem was with my coupled signal with voltage comparator... you think you genius!
Thanks heaps for your help.
Don
-
Hello.
I created a VI in order to compare the measure. I start with a simple button.
I want to replace the button with a myDAQ data. But read the data on sent myDAQ of data streams, and I need only one value? How to extract a value from the stream?
Pascal
Hi Pascal, see the attached VI (old version, but should open).
Place your daq assistant as shown and see the results.
Hope this is what you are looking for.
Best regards, W
P.S. I could not resist to show an alternative to the structure of your business

-
PXI-5105 clipping voltage to ~ 19V
The PXI-5105 should be able to measure voltages of Ridge Crest of 30 V. I have a set of 3, 9V batteries to give me a total of 27 volts through a resistance. PXI clips this tension about 19V however. I confirmed with a multimeter I have 27 volts. I have a value of 1 Mohm input impedance.
Thanks for any help.
Hi cuxcrider,
The maximum range of 30 V on the 5105 is a peak to peak voltage, which means that the higher voltage, it can measure compared to ground (0 V) is + 15 V, except if you apply a DC offset, which unfortunately cannot be done on the 5105 OR. Generally, you will see a little higher than the specified value rail voltage, but generally you shouldn't play in this region because you may cause damage to the Board of Directors and measures out of spec. hope this helps,
-
NEITHER USB 4432 readable voltage i.e. the ASPM signal conditioning
Hello
For what I understood that the USB-4432 entries must read IEPE accelerometers report. Read a voltage signal conditioner of my sensor ASPM IE using the option 'IEPE-off with AC coupling.
Thank you
1. What if I use the 5th cahannel of
4432 read the square wave pulse width, i.e. the digital signal
tachometer using any function of sounds or labview software and
Vibration Measurement Suite. If so, how precis specific will be read
frequency (speed) compared to meter modules.Channel 5 is the same as the other channels of the 4432 except it lacks excitement IEPE and TEDS. I can't really say how "accurate", it will be at a faster rate because of the delta-sigma ADC. Someone else wants to chime in on this one?
2.
Is available to trigger analog acquisition of digital triggering. If so, is
It possibel to read all 5 channels togather in a single task.You're talking about!
3.
If there is only one PFI then is possible to trigger two
different tasks, i.e. a task of 02 strings with front amount and
a further task of 02 channels with the falling edge of the PFI even.There are 8 PFI lines, but can only be used on the device at the same time (it might as well be one PFI). You must have all the channels you want to raise in a task and use one as the trigger for starting digital PFI lines. (i.e. 'no'
... have a stain on the front and the other on the falling edge won't work, a task only by digital triggering)Germano-
-
I am in a position the output of a piezoelectric sensor. It's just a generator of analog voltage with output to two pins. Rated power rises almost a volts peak to peak, and when I have those two pins feed scope, I see exit in this neighborhood when I stimulate (type on) unit, at least rise above 400mV peak-to-peak.
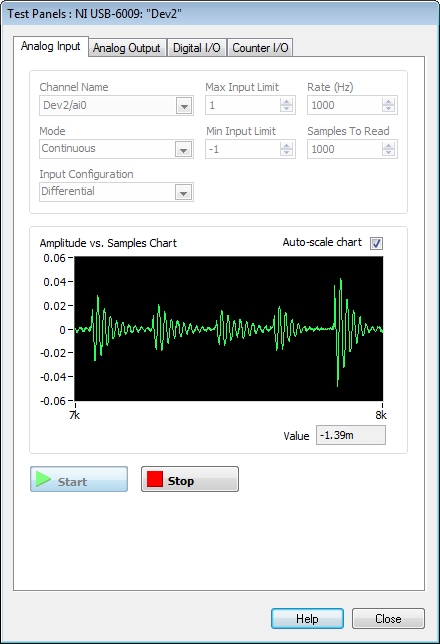
Now, I would like to read this same sensor via a USB-6009. I had no luck in unbalanced mode (almost all the noise), but the signal seems correct in differential mode. If I connect a sensor just to the AI0 + and AI0 - pines on the 6009. I do all my tests in the "Test Panel" Max right now. I have install the channel, generally defined entries max/min 1 and -1, respectively, than the configuration entry in the "differential", set the "continuous" mode and the rate to 1000 Hz and 'samples to read' to 1000 (so the screen is updated once per second).
Here are the two questions I have:
Output overall is a very low reading compared to what I'm used toseeing on the scope. Instead of hundreds of millivolts, I see more as 60mV peak-to-peak. Signal-to-noise isn't bad, but I feel it could be much better, and it's better when I read the same signal on other devices (a scope, for example). Some advice on why I see this output low voltage when wiring in the differential analog inputs on the 6009? Here is a picture of my capture window:
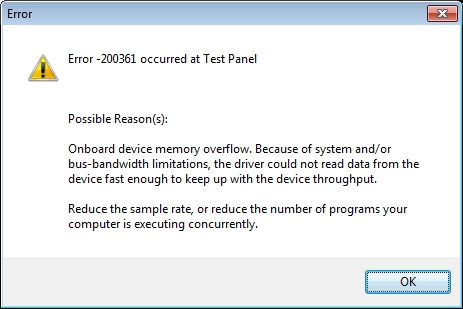
* Second question: almost every time that I have to stop and reset on the device, I get the following error:
I have to unplug the device and taking again to make it work again. There is nothing particularly CPU happening on my machine, I am not anywhere near the limit of bandwidth of the device or bus and it feels not like it's really a matter of charge anyway since it works _always_ the first time I press 'start '. Soft-reset the device does not help when this happens, I need to unplug the device and plug it in again. Any ideas what might be happening here?
Thank you!
-Dan
A piezoelectric sensor generates a charge and has a very high impedance. The correct way to fit your 6009 is a charge amplifier. It is possible to measure the power as a tension, however you need at least an amplifier with a very high impedance of entry AND short cables Hat!
If your results are very reasonable
 take a look at the two devices input impedance.
Depending on your skills to weld a simple (maybe not so linear) charge amplifier can be build with a high, low impedance input amp bias current op and a capacitor (poly) > resistance 10 M...
Take a look at this LT1113 OP
or the LMH6611.
-
How to start a timer in labview, when a signal crosses a threshold of voltage
Hello
Please could someone help to find a way to start a timer when an event occurs? (like when a signal crosses a threshold of voltage)
Thus, I would ask that help me cope with the following question:
I'm acquiring a signal from an acquisition of data and comparing it with a certain threshold value. Once the voltage of the signal crosses this value, a timer should start and will continue until 30 seconds, IF the signal value PERSISTS beyond the threshold. The timer must be set back to zero if the voltage of the signal goes back the threshold before a period of 30 seconds.
Thanks in advance for your support,
Bill
Hi Bill,
What version of LabVIEW are you using? If you are in 2009, you can actually save the .png to your computer file and just drag it into the block diagram of a white VI. Also attached is the VI even recorded in LV 8.2 (the feedback node has been replaced with a shift during the downconversion register).
Best regards
-
USB-6008 LABVIEW 8.2. SINGLE CHANNEL WITH DBL INPUT VOLTAGE OUTPUT COMPARISON
I AM WRITING A PROGRAM THAT USES A SIMPLE USB-6008 ANALOG INPUT CHANNEL. I WANT TO READ CONTINUOUSLY THE VOLTAGE FOR 60 SECONDS. I WANT TO COMPARE A TENSION FOR THE PREVIOUS OF THIS SAME CHANNEL VOLTAGE, MAINLY FOR THE PERIOD OF TIME MAX VOLTAGE GIVEN, THEN GET A FINAL VOLTAGE READING. THE OUTPUT OF THE VI IS A DBL. I WANT ONLY TWO TENSIONS OF EXPORT TO EXCEL. TO SAVE TIME, I KNOW HOW TO EXPORT. CAN SOMEONE HELP ME WITH THIS ONE.
VI needs an register shift related to the Max & Min function. The current value would be the entrance is and the entrance of x is the left shift register. The max value gets wired for the shift register to the right. Don't forget to initialize it. The output of the shift register is the max you would write and the value of the DAQmx Read out of the loop of wire will give you the last reading.
Your waiting for 45 seconds makes no sense since you said that you wanted to read continuously. You also said that you wanted to read 60 seconds and all this logic is missing. A simple function of time elapsed, it's all you need.
-
With the help of driver and comparator on cards PXI-6552 to test DUT Tristate
A functiona test, I need to check that my DUT outputs are tristate at some point in time.
Is it possible to use the generation pin electronics driver to drive a voltage of mid range (say 1.6V) and the electronic pin Acquisition window comparator search the tension considerably away from that level (Vil = 1.4V and HIV = 1.8V)?
So far, the problem is that the WDT waveform format allows a unique nickname by pine and there is no alias indicating drive and compare the two.
Maybe I have to set some attributes HSDIO who turn manually the drivers and then look for invalid data (between vile and HIV) during cycles when the DAE is tristate?
Hi Brian,.
Unfortunatelly the 6552 does not support the States 'lead and check '. The PIN every time he compares goes in three States. Perhaps the best solution would be to get the acquired data and to verify the State of the PIN to this particular sample. In this case, you define your waveform to drive a value and the acquisition will acquire what you are driving (or what's left of the signal). This can be problematic if you run complex scripts, because it is difficult to understand where in the waveforma which is particular State, but electrically measure is correct.
Let me know if you have any other questions about this work around.
Kind regards
Juan Carlos
-
Help the spikes of voltage high frequency Counting
Equipment: NOR USB-6229 (250 ksps / s analog in., 16 bit DAC, 32-bit counters, and internal clocks)<= 80="">
LabView 14
Problem:
I have an experimental app where I need to count the points of tension (entire #) caused by electrons striking a sensor. These tips can be as frequent as 500 000 heads of charge/sec. The tips aren't going to be the same tension every time, but they will be visible above the noise, so I need allow the user to select a threshold voltage that triggers a true count rather than the tips of noise.
Attempts:
To count such a high frequency, I gather that I need to use a counter entry to read fast enough, HOWEVER, I wasn't able to find a way to define a threshold of voltage for a counter entry because I think they expect a TTL signal anyway, which I won't. To set the threshold, I realize reading of analog input can be triggered at a point chosen, which is great, but the Analog Input sampling rate is only 250 kech. / who will not catch count each in my project.
I have a program that uses the channel count edges and it is accurate to 3% of the # expected charges. I was looking at him just with a function generator and the program does not count unless the signal voltage is higher than V 2-3 who does not work for my application. I'll post what I have. Someone know how to trigger at certain levels of tension using counters, or know a way to filter through the noise to get real tips?
Thank you!
You will need a device with a sampling rate of greater than 1 MHz analog input or you will need an external reference. With the external comparator, you can use output to set the threshold, although the user would not be able to see the signal or the threshold, only the analog account result.
Lynn
-
using the comparator and DAQ to light a LED
I use a comparator in Labview to compare the sine wave with a fixed voltage and then displays the result (1 or 0) on a waveform graph. How can I use the result of the comparison to the output of a data acquisition to light a LED (eg. when the result is 1)?
In LabVIEW, click
... ... ... ... . The block diagram for VI will show you a table of Boolean as input. In order to use a single Boolean value instead, specify a single line in the VI 'create task' (for example, Dev1\port0\line0) and plug your LED to this axis. Then, in the code, select "single channel / simple sample / Boolean instance (1 line) of writing DAQmx.» Wire then the exit of your writing's Boolean entry DAQmx comparator. If you change the VI, save it under a different name in a different location. NOT crush the example of VI.
Hope that helps!
d
-
I'm sending a voltage to a node we build and seek to control the message BOX the node spits back, which is converted into a real number of PSI by one of our consoles. How can I just wait for a single message and CAN have other compaired so that I can check in a test that the message is good? I tried using the table 1 d search and had no luck. I look at the messages that are either spit back and I know that the correct message is coming out, but research 1 d arrray always come back with the same message. Any help would be great. Fred
You use the channel API or API of frame? If you use the API of frame, have you seen the example of filter provided by the driver NI-CAN? If you have installed NI-CAN driver and LabVIEW, NI-CAN install example screw in your example Finder. I think that one of them performs the functionality you're after.
For the example of the 2 Filter Mode.vi series:
Open LabVIEW. Open the Finder for example ('Help' are examples). Navigate to hardware input and output"PEUT" Framework API' base' series 2 Filter Mode.viThe VI Description:
Shows how to use the filter attributes Series2.This example is similar to the CAN Receive.vi example, but allows you to set the attributes of series 2 that filter incoming frames. To learn more about the filter attributes, see the description of ncSetAttr.vi in your NI-CAN hardware and software (http://www.ni.com/pdf/manuals/370289k.pdf) manual.
VI instructions:
Start this VI on a series 2 NI CAN map. Transmit frames with different IDS from another device CAN to this card. Managers who pass the filter will be displayed on the front panel. Every time that you change the filter settings, press the button "Change filter settings" to use the new values.
Click on the "Configure" button to see how the resulting filter is created from the values of the series 2 comparator, mask and Filter Mode. You can also configure the new filter settings in this dialog box.Press STOP to stop the VI.
I think it would be an excellent starting point. If you have any questions about this, please let me know.
Kind regards
Mark E.
Technical sales engineer
National Instruments
-
VI data on average compared to the data from the Excel file on average .lvm
I am trying to build a .VI to measure voltages on a channel of a transducer of pressure for a period of 3 minutes. I would like the .VI to write all the samples of blood to a file .lvm with another .lvm file that comes from the average voltage over the period of 3 minutes. I built a .VI making everything above so I think that... The problem I'm running into is when I opened the file .lvm of all samples of blood in MS Excel and take the average of them using the built-in Excel function (= AVERAGE(B23:B5022) for example) averaged and compare it to the .lvm file, which has just 3 minute average .VI voltage, they do not correspond to the top.
This makes me wonder if I use VI with an average of function correctly or if maybe VI averages data different voltage than what is written in the .lvm file.
Does anyone know why the two averages are different and how I can match.
I have attached a picture of my functional schema with the file .VI for clarity.
The Type of dynamic data of LabVIEW you use is a special data type that can take many forms. It therefore requires the use "Of DDT" and "DDT" for the conbert to and from other data types. These special conversion functions can be configured by double-clicking them and specifying the format you are converting from. You can find the functions on the pallet handling Express-Signal.
I've attached a screenshot of the modification of the code using the "DDT" and the average is very good.
Please mark this as accepted such solution and/or give Kudos if it works for you. We appreciate the sides for our answers.
Thank you
Dan
Maybe you are looking for
-
I need to talk to a support person
I downloaded Firefox, but I can't find the address bar. How to find the so-called Awesome Bar?
-
Update of Adobe Reader for El Capitan
I received a notice to update Adobe Reader and requested he return later. He never appeared again - will someone please tell me what version I need for El Capitan and also PLEASE send me a link to the correct site? Thanx
-
Can how I clean my macbook
-
Public static sound speakers G500s
Yesterday, I bought a G500s, and now I want to connect it with my (speaker with battery) Ion tailgaterbut when I connect it with the tailgater I have a static noise, and if I want to load the tailgater (and leave only it connected to the laptop) a hi
-
Monitor on laptop erased when additional monitor was attached.
Hi, I hope someone can help me please. I have a HP Pavilion laptop g7. I tried to add a monitor to the laptop so that I could have two monitors. I did this by adding a projector. When I did my monitor on the laptop deleted. Please let me know wh