2D interpolation
I seem to have some difficulty to understand how the 2D.vi function interpolate
My goal is the following:
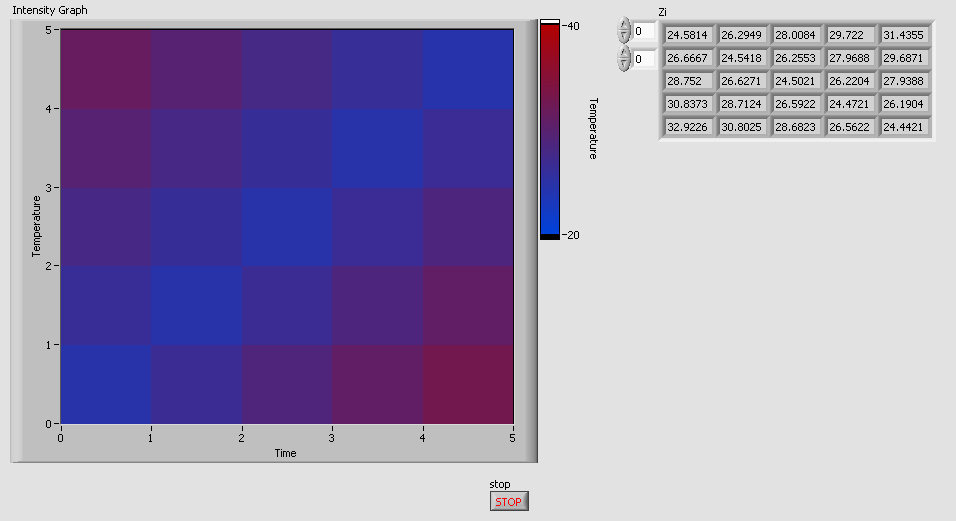
I have a 7 x 7 grid, which means that there are 49 items.
Now I know values measured at 5 points and details their cartesion.
For example
_ _ _ _ _ _ _
25 _ 25
_ _ _ _ _ _ _
_ _ _ 35 _ _ _
_ _ _ _ _ _ _
25 _ 25
_ _ _ _ _ _ _
So I know that the value is 25 to the point (1,1) and the value is 35 to (3.3)... etc.
I tried to use the 2D function interpolate to generate all other points, but I get strange results. The dimensions of the 2D results matrix are larger than the input array, that shouldn't be the case. I input an array of 7 x 7 and the output of the interpolation function is 13 x 13, which I can't understand.
The first thing that caught my attention, it's that when I generated an initial array, I filled all NaN cells because I didn't want the function to use values from 0 to interpolation. Is this correct?
Please see the VI attached as a simplified example of my problem. Any help would be appreciated!
Eureka 
It ends up being Interpolate Scattered.vi 2D that did the trick.
Now that the NaN is replaced, I get a nice full field.
Tags: NI Software
Similar Questions
-
Point of intersection between the line interpolated in Grapher
How to find the point of intersection between interpolated lines using points offered as input to a file in grapher comps?
What version of Mac OS X?
-
Hello
I would like to smooth out motion of my linear motor. For example, I would like to start a program on the cRIO in scan mode Let's say 1ms interval scan and then perform the interpolation between the points of output (for example, the wave of fishing) on the scan interval 100us. FPGA I wrote programs little but my linear motor does not move. I can't find where I made a mistake or / and something is missing.
Any help would be approciated.
I put in the attachment of my FPGA file, but also the host file I have on the cRIO.
Thank you.
Kamil
Dear Alex,
Thank you interested in my topic. I just understood how do. I went by this example: http://www.ni.com/product-documentation/3598/en/. However I have modyfied somewhat FPGA interpolation method. One described is nove myself smooth enough movement. I have attached files if anyone will need one day. I think that the case is closed.
-
Problem mit Kennfelddarstellung/Interpolation
Hallo,
Combi DIADEM-Neuling (Version 2012) bin und habe zwei problem:
Dazu:
Die representation meines efficiency-Kennfeldes mit dem Diadem Viewer values ranges erzeugt, die're enter kann nicht (rote Beriech über 100% Max-Wert bei obwohl ~ 92%), see 160927_Bereich 2_Triple_Darstellung.jpeg).
Woran kann das liegen und gibt are possibilities die Interpolationsart zu verandern?
Zweitens:
Den zwischen Die Interpolation erzeugt "Uberschwingungen" points (see Grafik Uberschwingen, rot umrandeter Bereich), gemeint sind die Auswölbungen zwischen den zur Seite hin rights points.
Vielen Dank im voraus!
Beste Grüße
Hello student_dcb,
dependent von den Daten, die 3D-Interpolationsalgorithmen von gut arbeiten. Aus diesem Grund support wir ab DIAdem 2015 drei distinct procedure: uberarbeiteten SISPL, SCADI linear und einen (zusammen mit Teillasten). Bitte auf die angehangte Grafik once schau.
Gruss
Walter
-
Edge detection that VI has the interpolation is mentioned. I want to know the types of interpolation and how it will work. If anyone knows please explain.
There are mainly three types of interpolation used aboard to find IMAQ VI or any other edge vi.
-Help of VI http://zone.ni.com/reference/en-XX/help/370281AA-01/imaqvision/imaq_find_edge/
Order zero (0) Rounds to the nearest place of built-in edge
Bilinear (1) Uses bilinear interpolation to calculate the location of the edge
Bilinear fixed (4) (Default) Fixed-point of bilinear interpolation calculation is used to determine the location of the edge
-See the topic of accuracy subpixel for interpolation works in here http://zone.ni.com/reference/en-XX/help/372916T-01/nivisionconcepts/edge_detection_concepts/
- And this wiki on bilinear interpolation can help https://en.wikipedia.org/wiki/Bilinear_interpolation#Application_in_image_processing
-
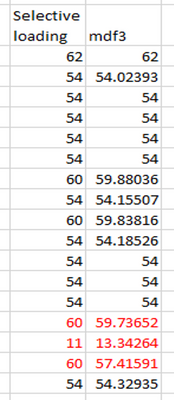
Hello!
I wanted to ask nicely if it is possible to load a .dat file using the use mdf3 but slaughter the interpolation process it does automatically, instead of linear interpolation I just want to keep the original values of the raw file...
I tried different ways for example: when I open selectivly it gives me the original channels but it lost certain values (size = 3426)... When I load the entire file he realizes the (unwanted) interpolation bt gives me complete channels (size 3443). Any ideas?
Thank you!!!
HI Maria,
I don't know any DataPlugins file that automatically perform interpolation when loading the data values-based. Could you post or send this data file that has the values you have posted?
Brad Turpin
Tiara Product Support Engineer
National Instruments
-
Interpolation - more than one point
Hello
I'm trying to find the position that a graph crosses the x-axis zero. The problem is that this happens several times in my chart (this is a graph of the reactance of a parcel of impedance). I use 1 d interpolation and it returns only one point of intersection instead of 2-3 that occur. Is it possible to get all three?
Any help would be greatly appreciated,
Bill
Typically when you need to detect multiple instances of a condition in a data table, you will find the first and then look for the part of the table after the first to the second. You probably won't find a built-in function that will do this for you. The process I described in my previous post will be repeated.
Lynn
-
tiara spectrogram Interpolation
Hello
I have an a spectrogram data set the faster the rotation of a machine:
a vector of length m with speed values
a vector of length n with the frequency values
a matrix with dimensions m x n with the values of sound pressure level
The problem is for the various measures I have slightly different speeds in my data record.
I want to interpolate the data of amplitude to a grid of speed defined by me, for example, 110, 120, 130... 2000 rpm,
regardless of the speed at which the measurement was taken, which can be, for example, 107, 114, 121... 2004 RPM.
With the linear 1 d of DIADEM analysis tool that's doable, but a bit complicated.
Is it perhaps a 3D tool in Diadem for interpolation that I need?
Thank you
Yannis T.
Hello Yannis,
Yes, DIAdem supports 3D interpolation. In the ANALYSIS, go to 'Area' and 'Interpolation '. You have several settings to set up your interpolation. 'Result Points' tab, you can choose "result Points take channel ' (for each, direction X and Y). This means, if you set a channel with your RPM (110, 120, 130,...) you can select this channel as result values (grid of X or the axis Y).
Greetings
Walter
-
SMU-5451. digital filter Interpolation
Hello
I use the SMU-5451 with FPGA SMU-7966R signal generator. They are related to peer-to-peer technology.
I want to use the digital filter of Interoplation, but there is a place to errors in the property node. Here is a screen of this error.
What should I do to fix this?
Looks like the 5451 doesn't have a digital interpolation filter. There is only a FIR filter on the device. You can check that this is the case and that the problem is not the use P2P when trying to run a script example that does not use P2P and setting this property. You should get the same error.
-
What method of interpolation using a characteristic diagram?
Hello
Does anyone know what interpolation method is used when you create a characteristic diagram (diagram outline 3D) using a triplet of data? Interpolation assumes that the fitted surface passes exactly through the data points. How is the rest of the calculated (interpolated) surface?
Am I right to say "Evaluation Points" in the dialog box diagram specifies a grid of x and y values for the surface to be evaluated at (by interpolation of the data points)?
I tried the online help, but it was a little lacking in detail.
Thank you
PorridgeMan.
Hello PorridgeMan,
The SISPL algorithm is used for this.
The method Smart interpolation Spline Surface combines a low requirement calculation of time with a high degree of quality of smoothing. The method requires only a few parameters. The method also accepts the imprecise input data.
Greetings
Walter
-
Time dilation of a curve with interpolation table 1 d?
Greetings,
I'm trying to run a time dilation of a curve I used to work with the table 1 d of function interpolate VI. Basically, I have to perform the expansion on each segment, that is why each segment contains 100 points, where there are currently 60.
I am currently working with two files (the two are broken) to compare because I'm not sure how to use the table 1 d interpolating VI, and what I have to enter for the fractional index. I know that the output of the table in the first for loop should go in the 1 d array interpolated somehow.
I'm stuck!
Thank you!
TheLT
I'm good I thought it
Here's how to do it for later use.
Code attached.
TheLT
-
Hello
I have a set of (X, Y) values, and I need to calculate either linear interpolation or some type of spline (e.g. linear) using these values, so I would like to know if OR Measurement Studio 8.6 provides a function implemented to achieve this.
Thanks in advance.
The following functions are available in OR Measurement Studio Enterprise Edition:
NationalInstruments.Analysis.Math.CurveFit.SplineInterpolation => for the spline interpolation
NationalInstruments.Analysis.Math.CurveFit.PolynomialInterpolation => for polynomial interpolation -
Hi all
I'm new to Labview. Probably, it is a simple question, but I'm really stuck on this issue. I have a XY Chart (resistance vs. temp thermistor; the curve looks like fucntion of disintegration), for each unit degree he is correspondent of resistance, but I want to get resistace corresponding to some temp decimal (like C 10.5 or 18.1) using some kind of interpolation. Any help here. Thanks in advance.
Try this. (assuming you want linear interpolation).
-
How to combine two tables: table of origin and its values of interpolation table
We get a new array of values after using the interpolation on a table function in labview, but how to combine the array of values and this original interpolated set of values in a single table?
-
Addition of waveform with adding block - element wise or interpolated or...?
Hello
I see the block addition is beautifully overloaded to overlay waveforms and I would like to know how it works. Specifically, I want to know if using matrix addition (i.e. simply by adding the elements of each waveform) OR is he among the waveforms by interpolation and resampling to the points of time corresponding to the other or another method.
I know that the sampling interval (dt) should be the same for both waveforms added, so I suspect it is using matrix addition, but don't know.
To add a bit of context, I use this to add two waveforms of sampled data of a sinus waves up to 100 kHz. Sampling faster than my DAQ can exploit the difference in the two waveforms of departure time (t0) is an important part of the period. At this point, I think that the approach by adding simple matrix will not work.
Thanks for any idea that you can give. See you soon
-ron
Hi Ron,
I don't think there is a VI that does it for you. However, it should not be too difficult to program yourself. There's a Subvi, called 'Get waveform components' that allows you to access the table variables (Y) t0, dt and the data type of waveform data. You can subtract the two start times to find the difference between the two waveforms (DAQ readings put a timestamp on the data). Then you can complete the table operations to create a lag in the data. A few other useful subvis are "Get the subset of waveform" or "Index Waveform Array", you can use depending on how you want to set up your program. Let me know if you need help with this programming. Good luck!
-
Interpolation of data within a volume
OK, I quickly wrote a trilinear interpolation from scratch. See if it works for you. (Attached VI is LabVIEW 8.2)
(Make sure that you are not indexing outside volume. There is probably a little more DIY and the necessary checks, it's just a rough draft.)
The definition of fractional indices is similar to the index table, except that the fractional value are allowed similar to my old bilinear demo, see also here)

Maybe you are looking for
-
screen freezes until the mouse is moved, firefox 36.0.4
I am running Win7-Pro running and Firefox 36.0.4 on my HP laptop and my wife's HP desktop. That office knows this 'freezing problem until the mouse moves on the screen ". The problem occurs in Safe Mode. Don't know what else to try, but willing to tr
-
I have several sites that have user names and passwords assigned and recorded in tools, options. Fire Fox no longer applies these when I opened the site. When I look in tools, options of the "Remember passwords for sites" is not enabled. How can I en
-
The search in the search bar, takes me to Google's China!
Hey, updated to FF13 when he told me. However, now when I use the Google search bar in the upper-right, it takes me to google China or another stupid country with messed up symbols.URL is https://www.google.com/ , but it certainly isn't an English ve
-
Hello! I have a new Toshiba Satellite with Windows 7 64 bit license. Now I have problem with power settings. When the screen saver is runing, after a while stops runing without moving the mouse. Also, the screen is not turn off after some time...It's
-
ENVY of HP dv7 - 7298ca Notebook PC
How to add a second drive on my laptop? Already bought a new disc and I have replaced my old drive, but now I want to add this drive as a second drive.