FFT of a signal display
Hello
I have a noisy signal to process (Please find attached an image of the signal) and I would like to use the FFT function on my signal to remove noise and recover the clean signal using the inverse of the FFT.
I have trouble when I use FFT because I don't have a single peak while I'm supposed to have a curve and the noise on higher frequencies.
Thank you
Take a look at the clip and see what I've added. Change the window size will change the threshold for filtering. I offset the result by one just to make it easier to see in the waveform graph.
Tags: NI Hardware
Similar Questions
-
Hello
Im trying to understand our noise of a laser. My setup is Laser - detector-Oscilloscope. I read the signal using a GPIB and Labview program. I think that I must take the FFT of the signal produced but it gives me nothing. I plugged the output signal to the FFT.vi and the result is a peak at 0 (zero). I should al least see peak around 60 Hz (light), but I can't. My sampling rate is 100Ksamples per second. Also, how can I see frequency on the x-axis of the curve of the FFT and what is Y Chart FFT plot?
Thank you
Yes. Without information from dt, spectral analysis function will assume a sample rate of 1.
-
How to display different sine waves in a table and do a fft of these and display them in a chart?
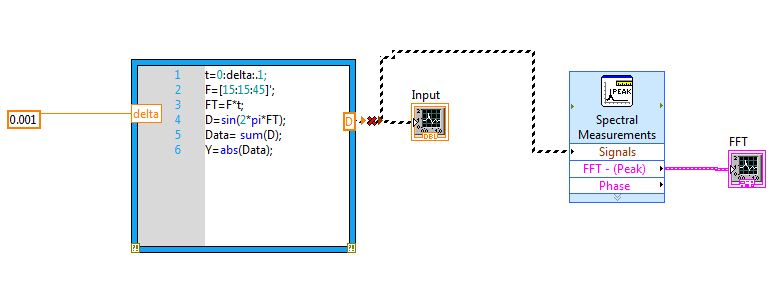
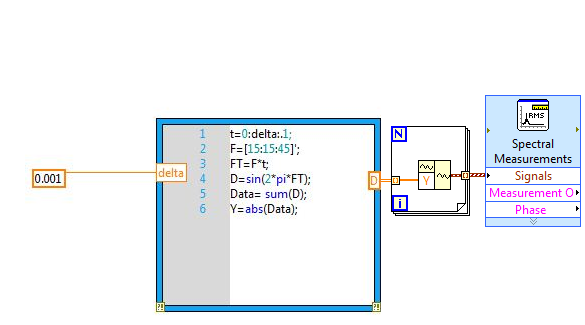
How can I cannect my mathscript output SIgnal of VI entry spectral measures. I have a problem since the release of the mathscript "D" file is 2D DBL. I don't know how to convert such data in order to be logged at the entrance of the signal of the VI of spectral measures. I also want that the waveform graph connected to the output of the VI measures spectral, display the FFT of three sine waves in a chart.
Do not connect. Just go to Forloop.
-
plot area chart mixed signal displayed
I have a graph of mixed signals with 2 areas of land and am trying to optimize the flexibility with the screen space and look at a. Sometimes I want to see the two draw areas in display at half the height of the graphical display of any mixture GIS and sometimes I need better display resolution that makes me want to make one of the plot areas fill the full graph of the display area and then simply scroll down to see the other.
What is the best way fo doing this if I want to press a button to easily switch between these 2 views? Use display port size and properties limits or something else? (The properties of ports and view limits are not well-defined dimensions of what I can find either)
Hello
You can do this by using a combination of several nodes of property. You can use the PlotAreaSize property to manually set the size of the individual parcels (not the viewport). Note that you need to use the ActPlotArea property to enable each parcel before resizing. After you set the size of the plots, set the size of the window using the window-> size-> all the items property.
I advise to use a structure of the event to change the properties when you click the button to toggle between the two views.
Hope that helps.
-
FFT signal who read analog spindle by Arduino
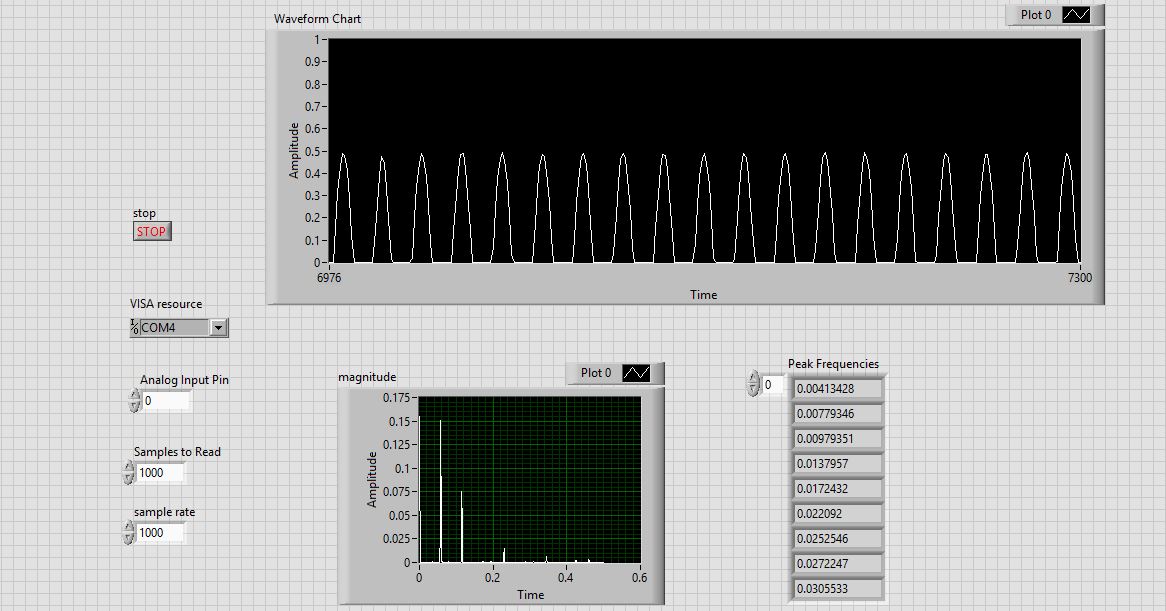
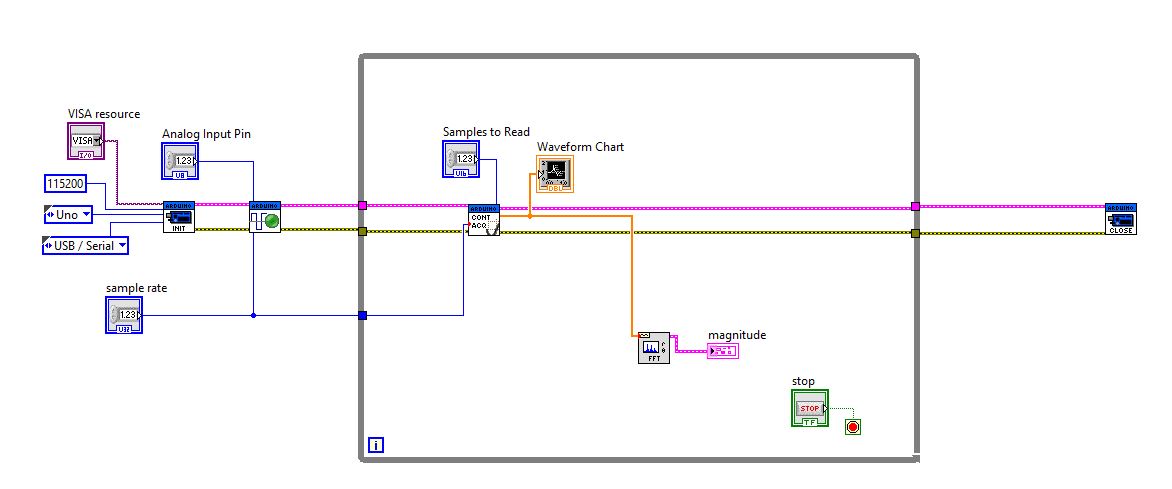
I use Arduino to send my signal to Labview. The signal display on the table good enough, but I could not achieve its spectrum (I'm testing with Vpp = 1 to 100 Hz sine wave).
What should I do to see the spectrum? I think (after ADC_Read function) output signal is quite different from others.
I hope someone can help me with this problem. Please, I really need your help. This is my final project!Attached, this is the Panel front and block diagram understand signal (don't care signal had only half higher due to the ADC_read, this isn't my problem) and the spectrum. Problem is that I do not understand why is the spectrum and how to fix it?
holucbme wrote:
Hi, RTSLVU
I use Labview for Arduino (LIFA) interface. I can fix the code in the firmware, bro?
Also, can you show me the above problem? (the FFT was inappropriate at 100 Hz)
I didn't know you guys were related.
Connect your graph of waveform over waveform after generating in the dT instead of the array of doubles. It will show the graph of calendar information rather than just integers on the X axis.
Are you sure that your input signal is 100 Hz? Are you sure that your Arduino is acquireing at 1 kHz?
-
Get the minimum frequency of three signals FFT
Hello
I put in work of a closed online using LABVIEW loop controller. There are three entrances of signal, the FFT of each signal must be calculated online and frequency spectra is the lowest to be detected.
The plot of the Spectra is attached...
Please advice on how to achieve...
Thank you
ruser.
-
Cannot write the FFT of the integrated double data
I am a beginner to Labview environment.
I have acceleration Vs time dat file .lvm
Can I get the double integration of this
acceleration data for trip data.
Can I get FFT of displacement and displayed on the graph.
Up to this point VI works
But now if I connect this FFT of moving to 'write the measurement file' then it displays error.
Please help me... and correct the error... All I want is two column data, frequency andthe other of the amplitude of movement.
I have attached all files
I ask you to correct the VI please...
Thanking you!The concepts that you'll want to research are"matrices", "indexing of tables", 'automatic indexing', 'cluster' and 'type of waveform data'.
The loop IN the first VI I sent used the automatic indexation to take each element of a table 1 d of the clusters and perform operations on them separately to convert them to a waveform. Exit tunnel also uses automatic indexing so that the end result is a table 1 d of waveforms. I used the loop, so that no matter how many items appear in the table, you get a corresponding number of signals to the "writing on a file of measures."
In this case, because the output of the FRF is a single cluster (and not an array of clusters), the loop FOR was not necessary. The VI attached this time takes the output of cluster of FRF and maps the cluster to a single components build the wave function and you get a result of unique waveform.
I have no sound and Vibe loaded on my computer at the moment, so I can't run your VI and see the result of the integration of the snout to the Cloaca VI. The output data type is "Table 1 d of waveform" and your indicator and your two FRF can accept only waveforms. I put a function between integration and the indicator/FRF array index, but if there is more than one waveform in the table, it would be the wrong solution. My solution corrects the broken wires but throws waveforms 2,3,4... If they exist.
-
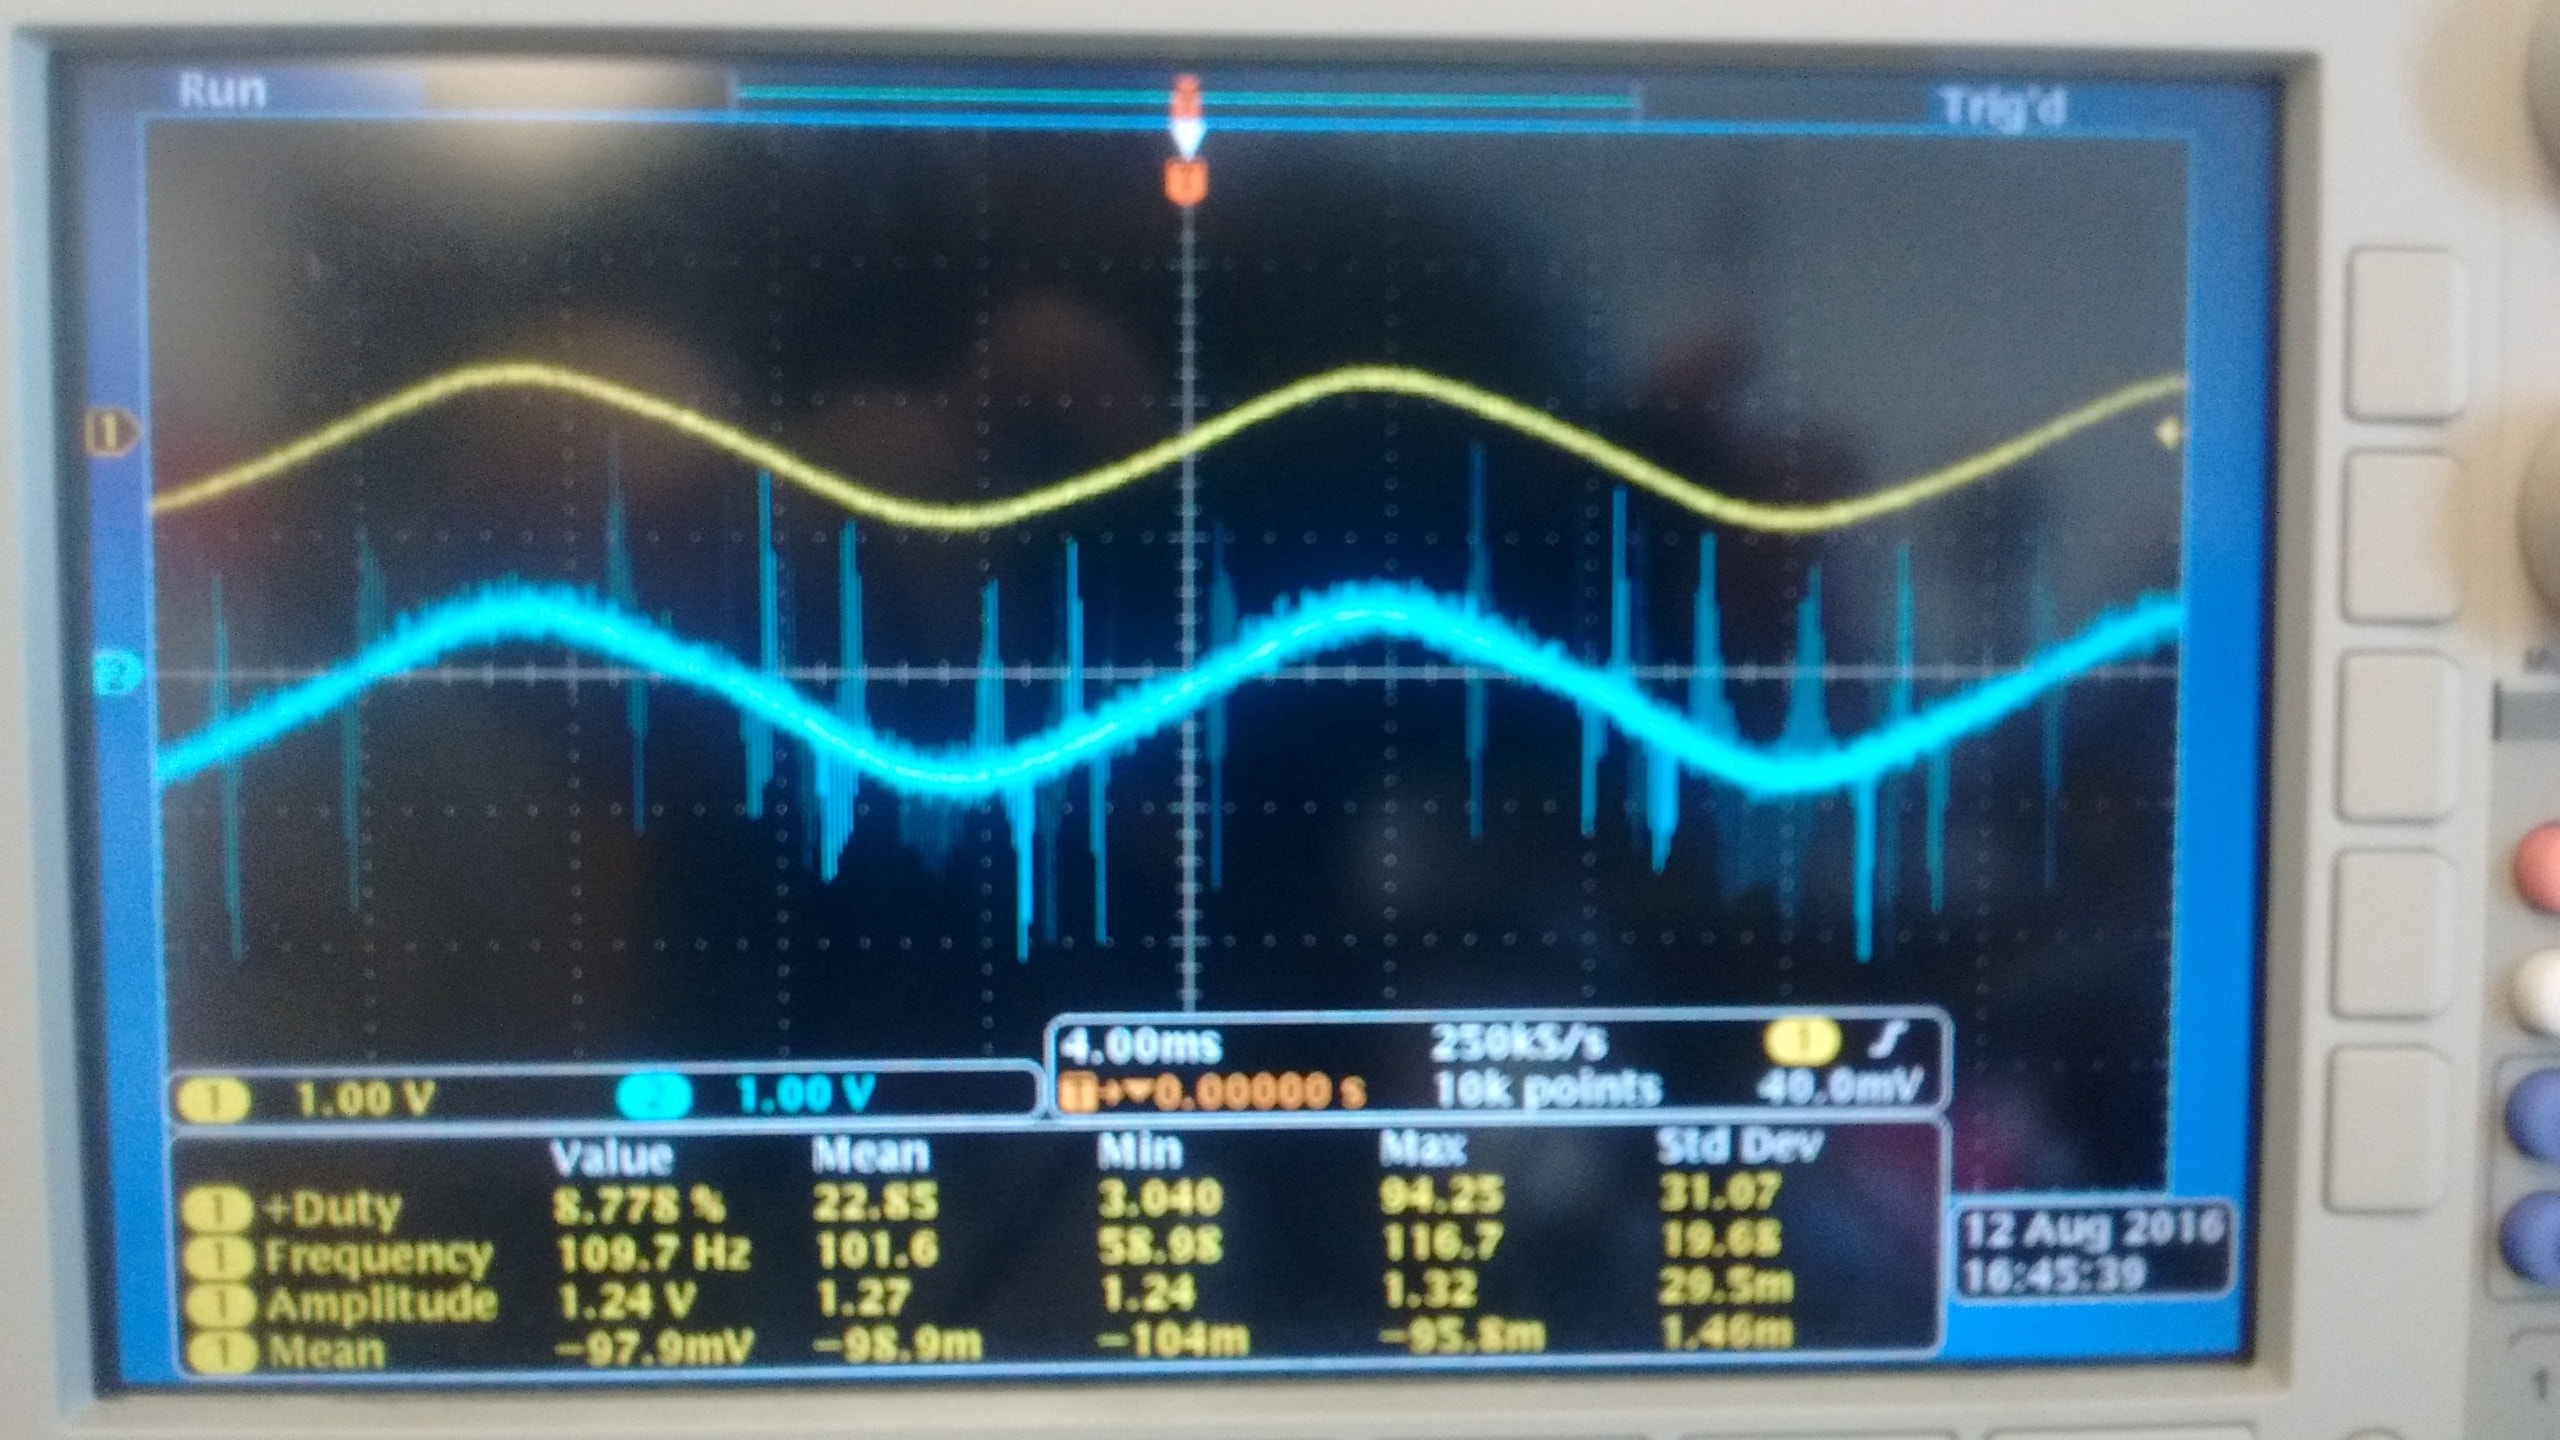
I currently use a NI 9215 module with BNC terminals to read the outputs of two different types of voltage sensors. Probe is a probe differential o-scope (Tektronix P5200A) which has a rejection of sound very good, while sensor B is a shunt isolated hall effect measurement using a LEM lv20-P and a custom PCB, which has a considerably lower noise rejection. Noise in the circuit to be measured is mainly the result of a H-bridge Inverter circuit that goes to 10 kHz. A picture of two sensors measuring the same signal displayed an o-scope is shown below with the sensor signal on top and B sensor on the bottom.
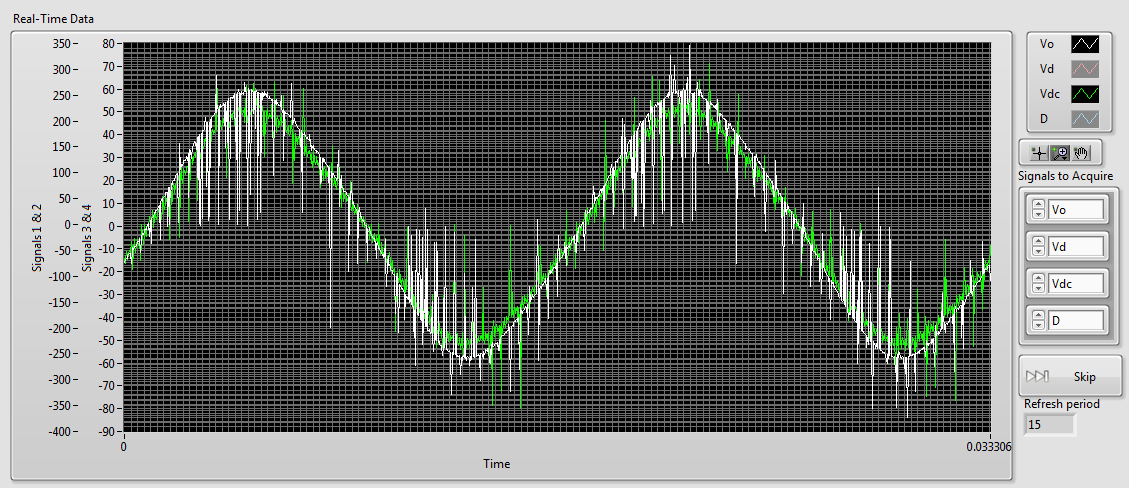
As you can see there is a lot of noise in the B sensor while sensor A is most often silent. When I connect then both of these signals to my NI 9215 I get the signals shown below (75 kHz sampling rate), sensor A appears in white and green B sensor (ignore the differences in scale, it's programmatically).
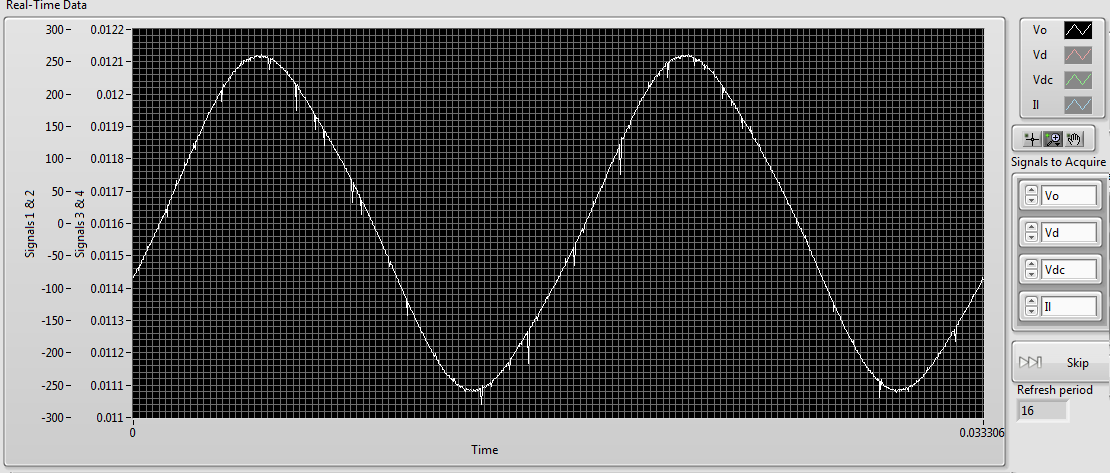
As you can see the noise level in the two now is comparably high. However if disconnect us the 9215 B, the signal from the probe sensor then replaces the image below:Although there are some present noise, the signal is much cleaner than before. The natural conclusion that I draw from this is that there is significant interference between the two signals. The same wiring is used for connecting to the 9215 as o-scope, and the two sensors use shielded twisted pair cables. This amount of crosstalk seems very high compared to the - 80dB listed in the specifications of the 9215. Any ideas what could be the cause, or how to fix it? Unfortunately, I am currently unable to afford a second sensor A.
1. by the impulses of the runt, I was meaning extremely short pulses on A sensor. If they are short enough, you will not see them unless you are looking for.
2. my concern is whether the switching noise is contaminant entering your power supply through the electric wiring. Of course, good feeds should filter this point, but it's just another thing to check.
3. the quick and dirty way would be to use a BNC T-connector to connect the oscilloscope and the ground in this way.
Suggestion of ferrite chokes on instrumentation Henrik is a good.
I understand that this type of inverter using the load (normally three-phase current motor alternative) to filter the frequency of bridge (10 kHz in your case) to the required frequency (normally 50 - 60 Hz). This means that high frequency currents go all the way to the motor, if they are not filtered by the cables first. You can not just screen the housing of the inverter, because the currents of high frequency down to load part of its operation. If you start testing things, you will all the way from the inverter to the load of the screen and will be impossible to Rodez to meet your instrumentation.
Standard WARNING: If you are tempted to connect directly to the UPS output and reduce until the input voltage range 9215: first of all, make sure that a qualified person has verified your wiring. Second place of fuses in all lines near where the tension is taken offshore. A UPS maybe a current loophole in the beach A 100 and you don't want that to the bottom of your wiring of instrumentation. Not directly relevant to your ad, but I feel that I specify.
-
USB-6211: analog input signal affecting another of the same map AI
Hello
I use the DAQ-nor-6211 map and DAQmx features to read a hammer and a signal of the accelerometer and then use other LabView functions to make the FFT of these analog input signals. However, it seems that the analog inputs where the hammer and the accelerometer are connected generate a kind of noise or influence in other entries of this data that is not connected to any other sensor acquisition board.
I've had different experiences in order to check if the problem is with reading the card: put the accelerometer and hit the dog in another table where the DAQ card table was located (to avoid the vibrations on the map and a possible noise), ai1 entry was logged on the differential mode on the dog and the ai4 of entry is connected to the output (z axis) of the accelerometer. The other 2 ai2 and ai3, entries that can also be read by my LabView program, are open (i. e., any other sensor is connected to the card). When the structure where the accelerometer is located is struck by the hammer, the signal of ai2 ("x axis" seen in the first attached document) has a curve (on the time domain) which initialize almost at the same time that the hammer and the a3 of entry has a weak signal, but with the swing as well as the signal of ai4. The document "hammer ai1 + z_axis connected_ _x_axis disconnected ai2 + y_axis ai3 ai4" images that I captured the chart created in LabView. On these graphs, it is possible to check on the FFT the ai3 signal and ai4 has the same behavior (with different intensities), and enlarged figure of time domain image, we can see that the signal of ai2 increase almost at the same time of the signal of the hammer (ai1). The signal picked up by the sensors are probably creating a sort of noise on open entries ai2 and ai3.
Another experiment was conducted to check if the signal from a single entry that may affect the signal read from each other near the entrances: the DAQmx task Create channel had a physical channel has changed: ai3 entry has been modified by ai7 (maintain the same connection mode: differential), and the results are visible on the second attached document. In the graphs obtained in this experiment, it seems that the entrance of the hammer (ai1) affects the signal of input ai2 and ai7, which are not connected. And the ai4 signal does not seem to influence the other inputs, because he has a different curve on the graph of the FFT.
The same experiment was conducted using the CSR connection (change threads and create the DAQmx Channel Configuration), but the results were the same as those found using differential connection.
Finally, if the output of the accelerometer is connected on the ai2, the signal of the other open entries ai4 and ai7 seem to be affected by the signal of the accelerometer on ai2 (last document attached).
Could you tell me if the problem I encounter is caused by the DAQ card with this information that I gave to you? And if the answer is Yes, do you know if there is a way to avoid this noise create in one entry on the other hand, it please?
Thank you
Maybe Ghosting or crosstalk? Just an idea.
-
Using signal (+/-10 000 g) accelerometer
Hi all
I use an accelerometer for measurements of vibrations.
The accelerometer is connected to an external excitation device to provide the excitement of the accelerometer (coupler-Kistler). The coupler is then connected with the NI SMU-6361 module which is connected to the NI PXI3-1073 chassis. Based on the gain of 1 and the excitement of voltage of +/-10V, the accelerometer can provide + / 10 000 g. I use assistant DAQ for now to see the signal and then moved to DAQmx. I chose the option of tension instead of tension with excitement and I put the settings +/-10V for max and min values of signal, CSR for Terminal configuration. I also used the option of scaling of the table for the g-10 000 to-10 V and 10 000 g for 10 V. The accelerometer does not seem to work properly as long as the signal does not change. Is it possible for the advice me what goes wrong with the configuration of acceleration it please?
Thank you.
How to set up the chain of coupler/measure:
Your sensor has a sensitivty (let's say it's a constant for a given frequency range) S_ug [mV/g] and you add the coupler with a gain of G_c [V/V = 1]. so you get S_total [mV/g] = S_ug * G_c
The acquisition of your data can read + 5V-(lire les spécifications en détail, généralement qu'ils peuvent lire jusqu'à 5.5V) and the maximum expected acceleration is?
You can always overtemperature or increase the G_c to measure your signals in an optimum range.
You read a voltage u (t) and g (t) = u (t) / S_total. You can do this conversion in your program, or tell MAX / DAQmx for that already in the driver.
You should read the manual of the hitch on the way to configure the gain or sensitivity.
If you measure the pulses, lockout for above 10 kHz signals... you can always use the sensor (up to maybe 40-60 kHz), but some more signal processing is involved in this case and make an FFT on the signal. (or a higher uncertaincy)
If you have the functions of transfer of the probe and the coupler, you can convert your signal in frequency domain, compensate for the functions of transfer and convert bach in time domain, to get a better estinate of your acceleration.
-
Hello
I built a vi that performs the FFT of a signal (~ 200,000 admissions in a 1 d table), during its operation, I'm not sure it will output the correct answer (or at least it is not sensible for me).
I'm trying to find the frequency of distribution. The signal was acquired to ~ 200 Hz. A screenshot of the output and the vi are attached.
Any thoughts? I really need help with that.
Thank you
simply_me wrote:
Rest only one problem - the two scales of the horizontal and vertical axes (horizontal must be frequency), no idea on how to change it?
The link does not show how to handle this issue (of index instead of the time domain).
You must set the increment of the x axis to reflect the appropriate units.
For the chart of field time, 1/200 and for the field of frequency to the derived value as described above.
You can set the increment of axis in many ways:
- Manually via the properties of the chart (-right click...) Properties)
- Via a property of the graph node (X - scale.multiplier)
- By grouping as illustrated in the city figure 25.
-
I'm figuring the FFT of several signals, I have used sine waves in the attached vi to highlight my problem.
I created 3 sinusoidal signals using signal generated express vi.
Sinusoidal signal 1: Fs = 20 Hz
Sine wave 2: Fs = 250 Hz
Sine wave 3: Fs = 500 Hz
I combined these signals in a table and fed in FFT Soectrum (Mag Phase) VI and see the results on a graph in the form of wave. I changed the property of multiplier of charts to the sampling frequency of the singal handset (1 sine wave Sine Wave 2 + Sine Wave 3) which is equal to 770Hz.
The plot of the FFT spectrum is throw up quite unexpected results. I expected peaks at 20 Hz, 250 Hz and 500 Hz, but I get crazy values.
I'm doing something wrong... ? Take a look at the vi attached please.
Stroke
Hi the shots.
You seem to be missing a few basics about LabVIEW data types as well as their manipulation...
You cannot add waveforms by adding berries to Y in a larger painting, you must Add the.
Play with the filter command in the attachment (to perform a control of it can make it easier...)
-
Currently, I am trying to perform an FFT on a signal in LabVIEW.
The signal was sampled at 10 kHz.
The output of the screw of the FFT for example are integer values. 1,2,3,4,5... I'm looking for 2 specific to 14.3 and 15.1 Hz frequencies. Earlier I get a peak at 14 and 15, but I want to be more specific. Is this possible?
Thank you
Scott
Read the detailed help for the FFT. It is said that the resolution is df fs/N where fs is the sampling frequency and N is the number of samples.
So if you get df = 1 and f = 10000, N must also be 10000. If you want the resolution of 0.1 Hz, you need samples of 100000.
Lynn
-
Calculation of signal to noise ratio
Hello.
I was wondering if it was possible to calculate the SNR of a signal with LabView? I use a DAQ hardware and an accelometer to measure a force.
Is that being said, possible to calculate SNR by looking at the graph of spectrum or vague? When there is no g on the accelerometer, there is a signal with a little noise... and I can see that in the spectrum of frequecny all the way to the cut-off frequency. What is the background noise?
I'd appreciate any help!
Thank you!!
Abraham_E,
Thanks for the data. Curiously, the data do not seem to care what language you were using when you got it.
The first data column appears as timing information. The dt in who is 0.0005, which corresponds to a frequency of 2 kHz. You said 400 Hz in one of your messages. The discussion at the point 2 below corresponds to a frequency of 2 kHz sampling.
1. you are right that SINAD is not very useful. SINAD assumes that all the power of the signal is the dominant frequency component that is not quite true for ECG.
2. the size of the FFT of the signal shows the dominant signals at 50 and 100 Hz which is likely to be able to line with frequency. Al here also erase lines 200 and 250 Hz. You certainly do not want to calculate SNR under the assumption that the desired signal is 50 Hz. The SINAD VI calculates the fundamental frequency than 49,97 Hz.
3. If you don't know the 50 Hz and harmonic components, there is no obvious lines in the spectrum remaining. I interpret this means you have the significant variation of heart rate data. This means that the heart rate is modulated in frequency. Frequency modulation broadens the spectrum.
4. because there is not predominant in the spectrum, it is unlikely that frequency domain techniques will be worth any in the determination of the SNR.
So, what can you do? Looking at the data graphic, I think a peak signal to noise power ratio could be significant. There are little noise, even at spikes, if it has a few problems too. I have divided the data set in 1 second segments. For heart rate in these data, each segment contains one or two beats. In each segment, I found the maximum and minimum values. I set the value from Ridge to Ridge for the segment of the difference. I also calculated the RMS value for the entire segment. Then the SNR is the signal from Ridge to Ridge divided by the RMS value. It is probably more accurate to use the RMS value of the QRS and exclude parts QRS of the RMS of noise, but to do both is algorithmically and by the much more difficult calculation. It would be also better force segments contain exactly one beat of each. Again, it is much more complicated. I then calculated the average of the SNR segment values and call it mean SNR.
As I pointed out, there are some problems with the definition (peak to peak/RMS). If you just want to compare signals within your lab to see which improves things, this should be good. If you want to publish data and compare to other published results, you have to find how they define and measure SNR.
In the attached VI I read the file once and recorded values in an array as a default value. Then I removed the file played screws and just worked with the data. To try this with other data simply insert read VI file in the appropriate place.
Lynn
-
How to measure/estimate bias of the signal
Dear Sir
I play the FFT of the signal that collects in real time of the hall effect current tranceducer SCT-013-005. I need to measure/estimate bias of this signal. Can you please guide me how I can do it. (My vi which is developed in LabVIEW 2012 is attached)
I'll be grateful to you for your attention and consideration.
Kind regards
Urfee
Hi tronoh,.
What about using the function 'Basic average DC & RMS' on your periodic signal?
Maybe you are looking for
-
Discussion of questions and answers keep coming
How to stop email to Inbox me?
-
Pavilion 1303au g4: processors running low tdp
model:-pavilion g4 1303au Processor :-amd a4 3330mx This processor is operated in 45 w according to the official website of amd, but the performance of Cpuz, it shows that it is running on 35.1 watts tdp. Can someone explain why this is happening, is
-
I started to use my double z3 with the smartband today, but it keeps disconecting and conecting throughout the day, vibrant 3 times when it disconects, it's annoying... Even with the phone in my hand that I use tha band, it disconects... It is broken
-
As an administrator, but he doesn't think that I'm? -Windows 7 Home Premium
Hey guys,. I use Windows 7 Home Premium on an HP laptop. In response to a previous question, I tried to run a SFC (System File Checker) scan using the command prompt (sfc/scannow). He told me:You must be an administrator running a console session in
-
"The task image is corrupt or has been tampered with. (0 x 80041321)". ___
When I try to run the backup this error pops up, 'the task image is corrupt or has been tampered with. (0 x 80041321)". I already tried the prievious solution and the first registry value is not found