FFT of XY table
Hi, I can't manage with table 2d FFT. I convert the data from excel. In labview, it is a 2 columns with array of 10000 lines. Then I traced chart XY in this table (using "build the graph XY") and it is well marked. Now I need to use FFT on this and I really can't understand it. When I use the spectral measures it shows something like one noise, or other random * beep *. How my VI looks like is attached below. Sorry for my English
I added a power spectrum in your VI. The result looks like what you would expect.
See you soon
Edgar
Tags: NI Software
Similar Questions
-
How to create a table of 0 and 1 as a filter after a FFT
Hello!
First of all, sorry if my English is not very large, I'm native French... And I am a beginner with Labview.
I would like to filter some of my noise using a FFT, multiplication by an array of 0 and 1 that I chose myself, and then make a FFT - 1.
I know there are filtration solution implemented in labview straight forward, but I really wish to go my way.
My question is: I'm a bit lost in the possibilities of painting. How can I design one that will have the line number I decide (I have a link with my sample) and a succession of 0 or 1, without having to type 0 and 1 two hundred times?
As a result, I just want you multiply the result of my FFt by this new table.
Thank you very much for your attention!
all those are adjacent?
If so, initialize a matrix of zeros with the length, the initialize a smaller array with all zeros and use 'replace the subset of table' to place in the largest table in the right place.
-
I would like to perform an FFT on a digital signal periodic sampling. For the moment, my signal is stored as an array of 16-bit integers (0-65534) item 8192.
I tried to connect this table directly at the entrance of the fft.vi X, but the data that comes out of the FFT {X} seem little logic (table length 8192 with spikes, the beginning and the end of it).
Any advice would be much appreciated.
Okay, that's better

The reason why you don't see the desired result of FFT is easy:
(a) you have a shift of 8000 to your signal. He is peaking at 0.
(b) your signal includes approximately 2.6 times. Given that the FFT concatenates virtually your signal from - inf to + inf in the time domain, your signal a 'jump' inside that create spikes in your field of frequency 'somewhere '. To prevent this, you can either use windowing or cut the signal of your time domain to contain a whole number of periods (which would then along 6400 samples).
hope this helps,
Norbert
-
How to display different sine waves in a table and do a fft of these and display them in a chart?
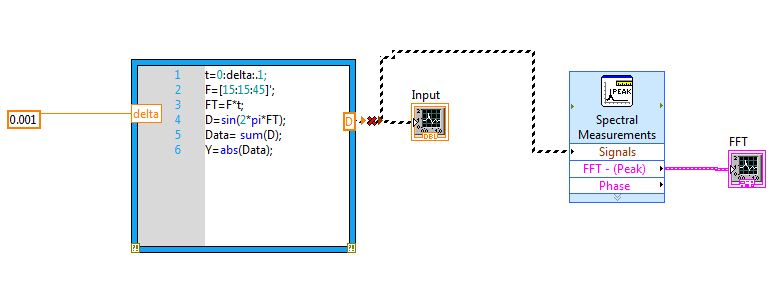
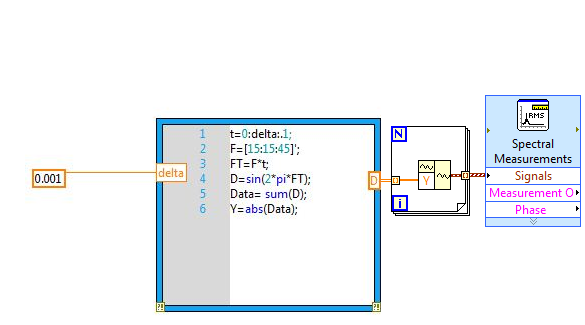
How can I cannect my mathscript output SIgnal of VI entry spectral measures. I have a problem since the release of the mathscript "D" file is 2D DBL. I don't know how to convert such data in order to be logged at the entrance of the signal of the VI of spectral measures. I also want that the waveform graph connected to the output of the VI measures spectral, display the FFT of three sine waves in a chart.
Do not connect. Just go to Forloop.
-
Hi all
I'm doing the analysis of the spectrum of a 2D array. In this case is Amplitude (Y) depth (X) vs. The problem is that the depth (X) is not a constant dt so I can't create a normal waveform as an input for the power spectrum analyzer or spectral measures vi.
It is an example of some of the data that we have:
Depth range (x) (y)
8390.7 -15.767 8391.2 15.767 8391.7 6.8555 8392.2 -6.8555 8392.7 25.754 8393.2 -25.754 8393.7 2.8505 8394.2 -2.8505 8394.7 -8.574 8395.2 8.574 8395.7 -16.145 8396.2 16.145 8396.7 -0.063 8397.2 0.063 8397.7 3.3945 8398.2 -3.3945 8398.7 7.712 8399.2 -7.712 8399.7 -6.267 Thanks for any help
-
Hi all
In my application, I'm analyzing a beep.
I used the spectral measurements vi for the FFT peaks.
Now I want to know the number of instances in which amplitues is over a certain limit, say 0.01.
Since I'm not an expert, I could really use some help.
I enclose my vi with a sample sound file.
Thank you
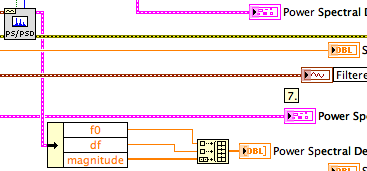
The result of the power spectrum is an array of clusters. Each cluster has three elements: f0, df and a variety of sizes. Ungroup all elements, use the table with a ridge detector function. Multiply the 'locations' with df and then add f0. The resulting table contains all vertices with the configured threshold already set on the frequencies to migrate.
Norbert
-
Why Express PSD gives a different result of amplitude as FFT PSD?
Hello
When I use the express VI of spectral measures to trace the power spectral density, I get a different result than when using the FFT PSD VI. The data are the same but the amplitudes are different in the PSD plot. Everyone comes through this?
Thank you
Donners,
The PSD2 and graphic PSD2 are different because you are breastfeeding two extra points in the tables (t0, df). When graphic entry of data in the tables, they interpret not automatically information of t0 and df. Actually they do not yet receive this information. You must program the scales with nodes of property. If you simply draw the order of magnitude, the spectra are very similar.
^ ^ ^ This confuses only the chart!
The spectral forms differ slightly as the power spectrum of FFT and PSD.vi uses a default Hanning window.
Lynn
-
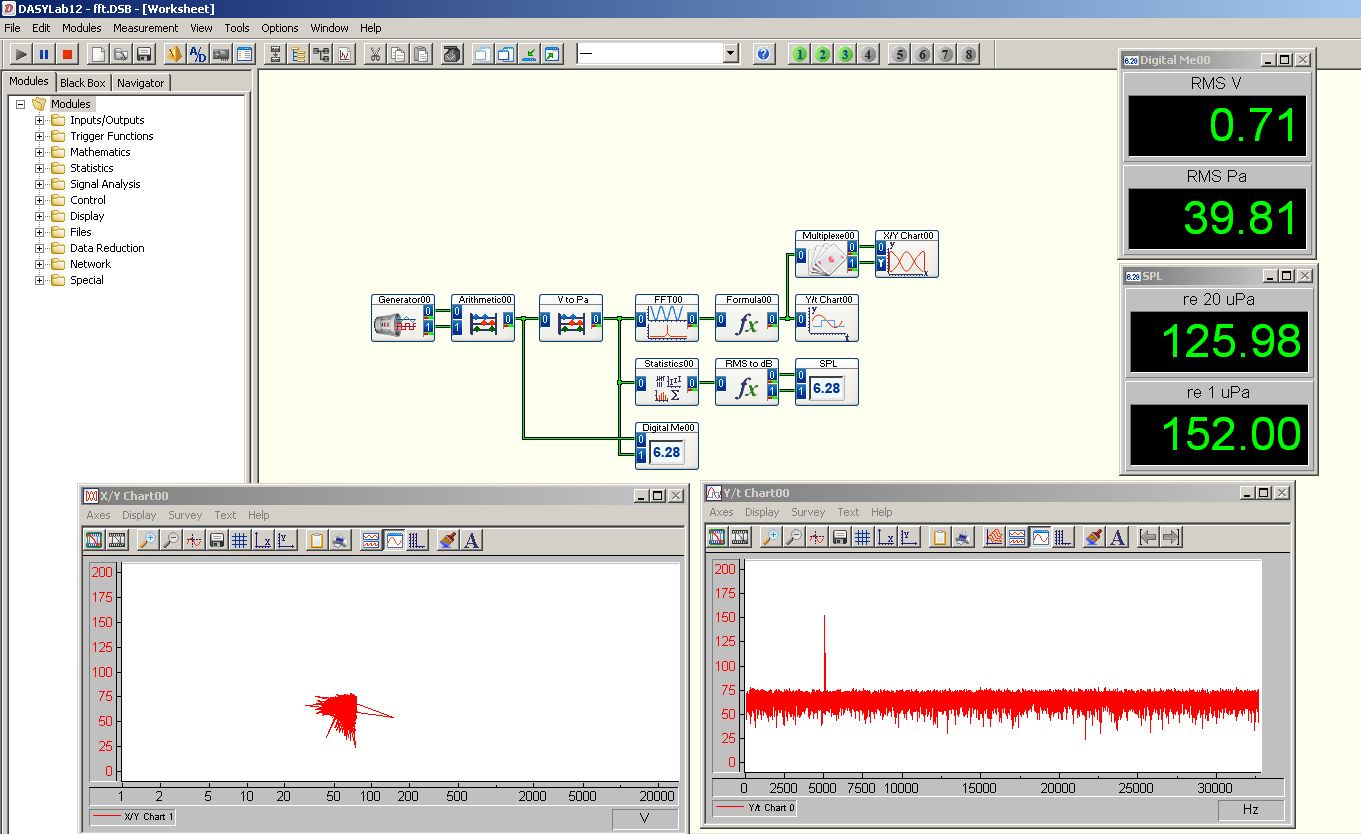
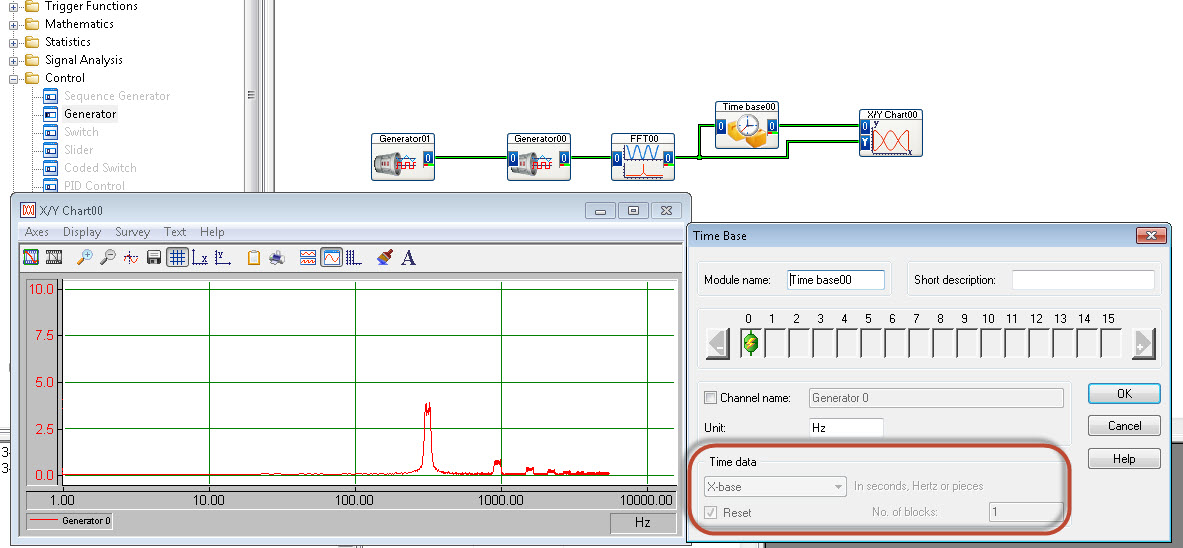
FFT to display with newspaper frequency axis
Hello
I'm trying to get my fft to display frequency (x axis) with a logarithmic scale.
There is no option for this in the table y/t
The xy graph has possibility of HRT, but I cannot "demux" the fft output signal successfully.
I use DasyLab 12.
Someone at - it ideas?
Thank you
Matt
Use the time Base module (special offer) to extract the x axis out of the block of the FFT.
-
FFT (up to harmonic (n) of the 2D array
Hello 150,.
I want to record a FFT for the specific frequency range. The entrance is a 2D table in which each row represents a record. I just need phase und amplitude of the harmonics (up to the n - controllable). I didn't need too many harmonics, so I would avoid calculations and do to the amount of certain frequencies in the FFT.
I would take this VI, but y at - it an option to set a range for the FFT? Or another VI accesses Magn. & Phase for harmonics?
https://zone.NI.com/reference/en-XX/help/371361H-01/lvanls/amp_and_phase_spectrum/
VS_03 wrote:
... (or is there a better way?)
Well, if you know exactly the spectral positions and the data are clean (no spectral leakage, without periods truncated, etc.), all what you need to do is multiply with the waves of the complex unit of frequency. (See also this for the amplitude of the fundamental frequency, can be easily added for more spectral positions.) Note that the FFT is very effective, so if you need a large amount of spectral positions, it might be faster.
-
Creation of 1 d-Array permanently FFT
Hey guys,.
Im making measurements of vibrations with an accelerometer on my mydaq. I already get my timesignal reading properly. Subsequently, I record these readings in a 1 d table. Now, I want to achieve a FFT spectrum.
But the illustrious FFT's are useless, they do not display something useful. I tried before to take a FFT is the express.vi and it worked perfectly. Has obtained Spectra as normally and worked well. But as Im not allowed to use the s express.vi in my project I can't use it.
So, any help would be very appreciated Im getting nuts with him and Im trying to get this race for 3 days...Thank you very much
LabView 2014
Configure the Read DAQmx for samples of N. reglez_ to return a data type of waveform. Connect to your fft function.
-
Hi, I know there are several ways to perform the fourier transformation in LabVIEW, but I don't know which one to use correctly.
I have a signal that is in the table and I want the signal analysis using the Fourier transform.
I tried the Spectral measure Express VI, Power Spectrum.vi, power spectrum of FFT PSD.vi, .vi spectrum FFT (Mag Phase)and FFT.vi (do not know the correct size of the FFT to use here, I just used 128).
Which should I use?
Thank you!
Bob,
Try to remember that without students, you would be unemployed. Interesting that all the answers so far have been people with extensive experience in academia.
JersonJose,
After looking at your last post, it occurs to me that perhaps to extract the Information.vi to your unique might work for you too. To use it, you need to create a waveform from your data that I described above.
Lynn
-
Hello. I really need a help. I have an excel data and then I use a FFT Real vi to get frequency data and wave spectra. Now, I want to use FFT windowed with the same data to excel, but was failed. FFT for real is a vector, while the entry for windowed FFT is an entry point. Can someone help me how to use the data to excel for FFT input with windows? or maybe someone can give me an opinion using "spectral measure. Thank you in advance.
Why not use symmetrical window VI before the FFT VI? He accepts tables and gives you the choice fo all common windows. It is in the Signal Processing > Windows palette.
Lynn
-
Hello
I built a vi that performs the FFT of a signal (~ 200,000 admissions in a 1 d table), during its operation, I'm not sure it will output the correct answer (or at least it is not sensible for me).
I'm trying to find the frequency of distribution. The signal was acquired to ~ 200 Hz. A screenshot of the output and the vi are attached.
Any thoughts? I really need help with that.
Thank you
simply_me wrote:
Rest only one problem - the two scales of the horizontal and vertical axes (horizontal must be frequency), no idea on how to change it?
The link does not show how to handle this issue (of index instead of the time domain).
You must set the increment of the x axis to reflect the appropriate units.
For the chart of field time, 1/200 and for the field of frequency to the derived value as described above.
You can set the increment of axis in many ways:
- Manually via the properties of the chart (-right click...) Properties)
- Via a property of the graph node (X - scale.multiplier)
- By grouping as illustrated in the city figure 25.
-
I have already tasted the data of an input in the time domain signal. the signals are sampled by ADC and stored in excel file (about 16 K samples). I need to feed to the FFT VI for the plot of the FFT. I tried several bolts of FFT, but nobody does not accept data samples directly which is stored in the table 1 d. Any ideas? Thank you.
Hi ABM26,
Your input signal looks like a pure sine wave. You perform the FFT and get the amplitude. So you get two peaks in the result. I think it is the correct result. Why do you think the result of the FFT is false?
And I realize that you want to calculate what the power spectrum. You can use the Signal Processing > spectrum analysis > Power Spectrum.vi directly.
-
I'm figuring the FFT of several signals, I have used sine waves in the attached vi to highlight my problem.
I created 3 sinusoidal signals using signal generated express vi.
Sinusoidal signal 1: Fs = 20 Hz
Sine wave 2: Fs = 250 Hz
Sine wave 3: Fs = 500 Hz
I combined these signals in a table and fed in FFT Soectrum (Mag Phase) VI and see the results on a graph in the form of wave. I changed the property of multiplier of charts to the sampling frequency of the singal handset (1 sine wave Sine Wave 2 + Sine Wave 3) which is equal to 770Hz.
The plot of the FFT spectrum is throw up quite unexpected results. I expected peaks at 20 Hz, 250 Hz and 500 Hz, but I get crazy values.
I'm doing something wrong... ? Take a look at the vi attached please.
Stroke
Hi the shots.
You seem to be missing a few basics about LabVIEW data types as well as their manipulation...
You cannot add waveforms by adding berries to Y in a larger painting, you must Add the.
Play with the filter command in the attachment (to perform a control of it can make it easier...)
Maybe you are looking for
-
Compaq Presario v2000 need help for recovery
Hello I recently got a virus on my laptop, and I am not able to get off at the stop. I just want to remove my computer laptop everything and restore the operating system. The Virus has disabled the start menu, and I have no recovery discs. Help would
-
Satellite C660 - 28 d - improve the graphics
Bought this laptop for college work, I do a lot of work in 3D on the computer and only just realized the integrated graphics card is not powerful enough to cope. I was hoping to buy a new graphics card and slot in there, but I have been informed by T
-
Broken power connector? Where to find one?
Hello the delayed of my thoshiba satellite is broken.Where can I find one? Thank you.
-
Several versions of TestStand (2013 and 2016)
Are there problems of having several versions of the TestStand development environment installed on my development machine? Thank you.
-
problem with the customization of the menu bar for the time of execution...!
I have created a user interface and want to give all selectable options to the user through cutomized launch time menu bar. However, I am facing a problem with that: If I click on any menu item in the bar, I'm not able to choose another option until